


2021: The Year in Review
Operating leverage, underestimating inflation, Progressive tax policy stalls, stocks are rich, bonds are richer

This is the final note of our three-part outlook note series. We began with 2022 Outlook: Inflation Policy & Politics where we described a deterioration in liquidity conditions, persistent pandemic effects, inflation policy & politics, and another difficult year for the 60/40 asset allocation framework. The second note, Macro Themes for the '20s Cycle, covered four macro themes we expect to persist through the business cycle. This is our year-in-review note, a tradition we began in the early ‘10s when we were head of equity portfolio strategy at Barclays Capital. We call our product “It’s Never Different This Time” because we believe you don’t know where you are going if you don’t know where you’ve been. Additionally, we hope those of you who write year-end summaries of your investment management performance will find this helpful. We are making this note available to our free signups in hope you’ll consider subscribing for 2022.
We also removed the paywall on our 2022 Outlook: Inflation Policy & Politics note to provide additional incentive to subscribe.
Growth, Prices, & Earnings
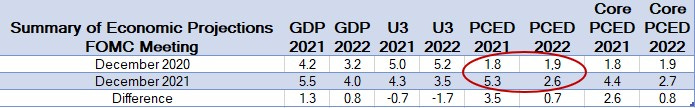
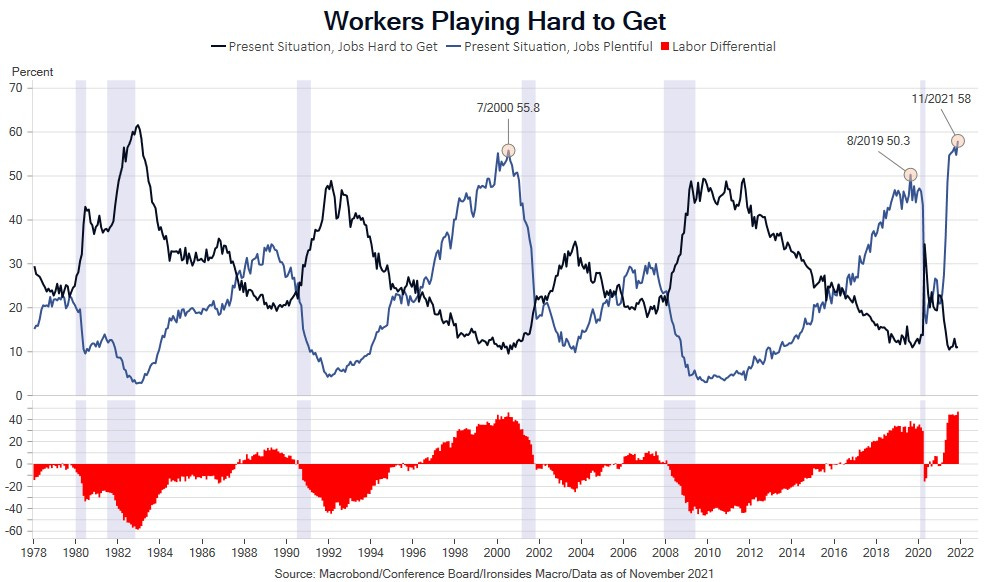
The subtitle of our 2021 outlook note was ‘Three Tailwinds and Looming Policy Risks’. The first two tailwinds were strong cyclical recoveries in global trade and manufacturing and with a bit of a lag, a cyclical and secular boom in capital investment. Global trade and manufacturing rebounded from a double-dip recession due to the US/China trade war and the pandemic, and a boom in capital investment following the Tax Cuts & Jobs Act slow down due to the negative business confidence shock resulting from the trade war. The global trade recovery has been even stronger than we expected, and it has maintained momentum through the year. The associated trade surpluses of export dependent economies created continued demand for US fixed income securities, a dynamic we expected to dissipate in the second half. We attribute the strength in global trade to three factors: pent-up demand from the double-dip global manufacturing recession, the pandemic lingering longer than expected and associated ‘zero-covid’ policies in Asia, and stronger US demand in part due to a $1.9 trillion stimulus plan in March that was not expected until the surprising Georgia Senate runoff elections in early January. A comparison of the FOMC’s summary of economic projections (SEP) from the December 2020 and 2021 meetings illustrates how badly consensus (not just the FOMC) underestimated the strength of the recovery in economic activity, labor market dynamism and underappreciated that the pandemic was an inflationary shock that ignited forces that were lurking beneath a series of late ‘10s cycle disinflationary shocks.
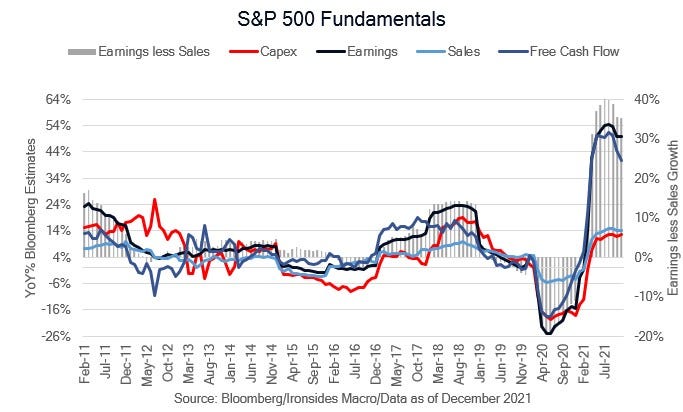
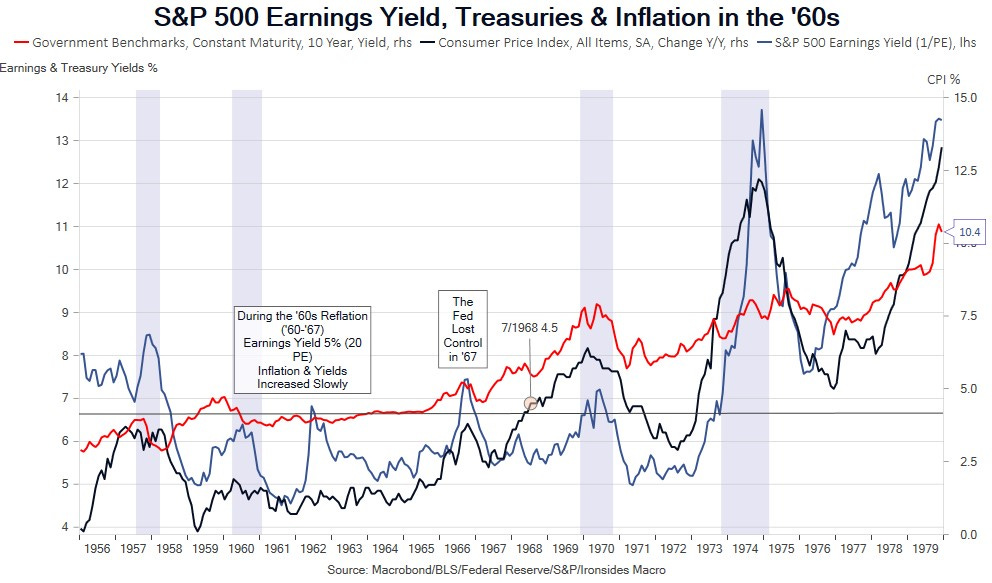
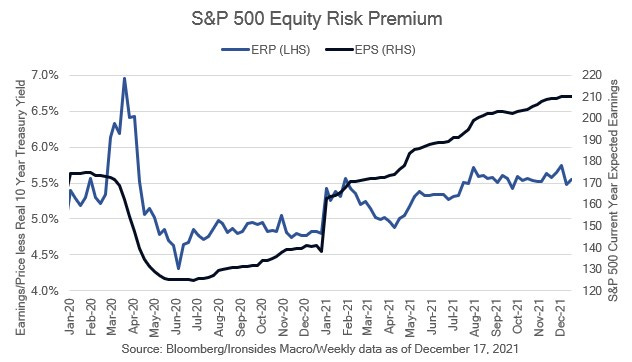
Equity analysts and strategists missed by a similar order of magnitude. The bottoms-up S&P 500 2021 forecast was $163 a year ago, the top-down strategist expected $170. Currently, earnings are tracking $210 through 3Q21 results, and the strategist consensus increased 34% from this time a year ago, to $228. The 2020 bottoms-up forecast in February just before the pandemic was $173.65, this represents prior cycle peak earnings. Using the ‘10s earnings growth trend of ~9%, the earnings gap was closed in June 2021 when the S&P estimate reached $188. The most probable explanation for the massive miss on earnings, and in some cases, strategists’ market expectations (consensus was for S&P 500 to end 2021 at 4035), was much faster inflation and the impact on earnings attributable to operating leverage more than offsetting the early cycle pattern of marginal costs increasing faster than marginal revenues. We generally got this right, in part due to our ‘60s analog when stronger nominal growth led to an acceleration of trend earnings growth from 8% in the ‘50s to 15% in the ‘60s until late in the decade when fiscal and monetary policymakers began their misguided attempts to contain inflation. In the spring when a number of equity strategists turned bearish, in part due to concerns about margins, we wrote that this was a typical business cycle pattern and we stuck to our framework to remain invested until and unless policy began to tighten.
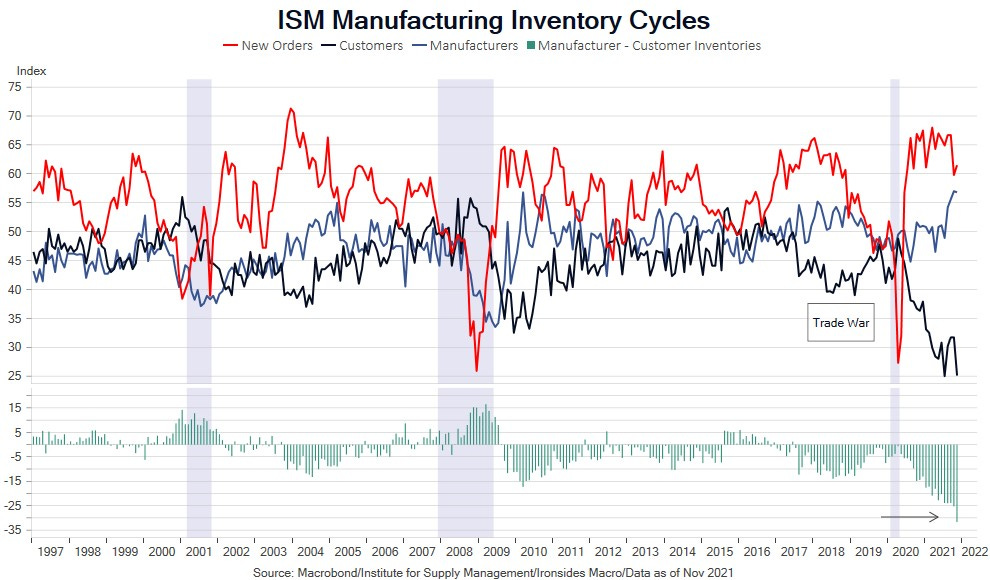
One residual issue that is the source of investor concerns is inventory restocking and the potential for supply chains to clear just as demand slows, which would exacerbate a production slowdown. The ISM Manufacturing Inventory Index is towards the high end of its longer run range; however, the Customer Inventory Index remains near all-time lows. Inventory to sales ratios are elevated for nondurable manufacturers but are normal for durable goods producers. Additionally, we do not expect much slowing in final demand. Auto sales are running roughly 25% below prior cycle trend, the November retail sales ‘miss’ appears to be the second consecutive year where the Commerce Department’s seasonal adjustment factors masked robust holiday sales and the household sector’s wealth, income growth, financial obligations and debt are the antithesis of the post-financial crisis that led to below trend consumption for the first five years of the ‘10s expansion. In other words, growth will slow in 2022, but won’t be slow. The major components of GDP are likely to all be positive in 2022: consumption of durables goods was constrained by supply, services spending should accelerate as mobility improves, capital investment is in the early stages of a boom, residential investment was also supply constrained, net exports should subtract less as supply chains clear and inventory restocking will add to growth as well. Only government consumption will negatively contribute to growth in 2022, but that is the least meaningful contributor to corporate earnings. Global supply chain restructuring will accelerate in 2022, as Schumpeter’s Gale (creative destruction) laid waste to decades of advancing Ricardo’s comparative advantage. We expect growth to exceed expectations in 2022.
The Third Tailwind
The third tailwind for risky assets generally and economically sensitive cyclical stocks, is reflation. There is both a compelling monetary case for a cyclical increase in inflation and a strong secular argument emanating from global supply chain restructuring.
2021 Outlook: Creative Destruction
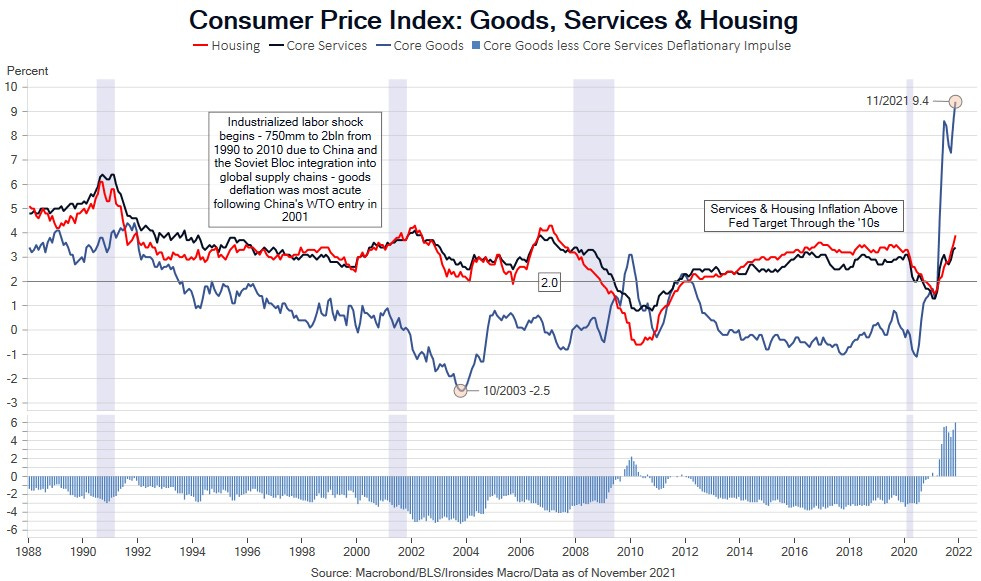
The December 2020 FOMC summary of economic projections implied they would not reach their inflation target until 2024 even with a policy rate at the effective lower bound for four years. When we reviewed our 2021 notes, it was rare when we did not discuss inflation. Reflation sectors and inflation breakevens rallied relentlessly from early November when the vaccine trial results were released through mid-May when reopening related inflation momentum peaked and the FOMC began to acknowledge the magnitude of their forecast error. The leveling off of reopening categories — used car prices, hotel rates and airfares for example — lasted for a couple of months before reaccelerating in the fall. Supply chain related sectors (new cars, appliances, etc.) gained strength through the summer. Service sector inflation recovered and is now above the ‘10s trend, just above 3% with housing likely to run well above trend and healthcare and education well below trend but unlikely to remain there. Our inflation correlation measure is rising rapidly, underscoring a broadening of inflation pressure as the effects of the most aggressive fiscal and monetary stimulus since World War II impact the general level of prices. Over the course of 2021, the monthly CPI arguably supplanted the payroll report in market participant focus and PPI evolved from an afterthought to significant metric as US manufacturers gained pricing power for the first time since the integration of China into global supply chains. The FOMC consensus for the personal consumption deflator increasing 2.6% in 2022 and ex-food and energy at 2.7% looks overly optimistic.
Policymakers Party Like It’s 1965
‘SCHUMER DELAYS CONSIDERATION OF BIDEN'S ECONOMIC PLAN TO 2022’
Our macro framework of three tailwinds and looming policy risks was disrupted shortly after we published our outlook when President Trump’s intervention in the Georgia Senate runoff elections gave control to the Democratic Party of all three elected branches of government. This raised the probability of the Biden Tax Plan impairing our expectation for a strong capital investment cycle. As we were writing this note Senate Majority Leader Schumer announced a delay of the Build Back Better (BBB) Act to 2022, an outcome that reduces the probability of passage to less than 50%. A full rollback of the Tax Cuts & Jobs Act corporate tax provisions was already off the table and Treasury Secretary Yellen’s OECD deal for a global minimum corporate tax deal is unlikely to ever get implemented.
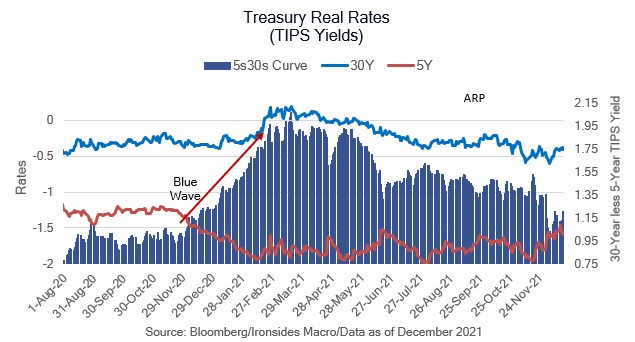
If BBB dies, the Democratic Plan to push us back towards the bottom of global corporate tax competitiveness will fail. The Democrats did pass the $1.9 trillion American Recovery Plan (ARP) in March using reconciliation, an unexpected event that led to a sharp move higher for long duration real rates (TIPS yields). This was the first time in four decades we recall the US Treasury repricing to absorb supply. It was a warning to Modern Monetary Theorists that the US was reaching its borrowing capacity. A key element of ARP was extending expanded unemployment benefits through the summer, and while red states largely opted out during the summer, blue states delayed the recovery in the labor market thereby exacerbating wage pressure.
With 2022 being a midterm election year, disruptive progressive legislation is unlikely, consequently, regulatory policy and trade policy will take center stage. While progressive financial sector nominations ran into resistance, antitrust structuralism targeting big tech has bipartisan support. Drug price controls might die with BBB, but energy policy will remain hostile to oil & gas. Ironically, this will serve to make this sector more attractive by restricting supply. The midterms are highly likely to flip the House, but the Senate is much closer.
The Fed’s June hawkish pivot led to our forecast for a 10-12% correction, and while the S&P only fell 6%, we reduced exposure to small caps, materials, industrials and emerging markets and these sectors struggled through the summer. Despite the Fed’s inflation forecast error and compelling evidence large-scale asset purchases were contributing to faster house prices appreciation than the peak of the ‘00s bubble, their reaction function was similar to the financial crisis when house prices were falling, and credit channels were impaired. It appears to us that a deep-seated belief in the institution that Fed credibility was the primary cause of decades of disinflation was integral to the 2021 policy mistake.
The Fed is intellectually invested in the Phillips Curve and dismissive of the exogenous shocks — Chinese labor, shale energy, the financial crisis, technology adoption in consumer goods and services — that were the primary causes of disinflation. Even with the current hawkish pivot, the 2024 target is a zero real policy rate with negative real rates for the next two years. Chairman Powell’s response in the December FOMC press conference to a question about monetary policy impacting the economy with long and variable lags indicated the Fed overestimates policy efficacy and underestimates unintended consequences. Monetary policy is a blunt instrument, fiscal policy is even blunter, and policymakers threw the kitchen sink at the pandemic. They turbocharged demand and exacerbated the supply shock. The public is paying the price for the fiscal and monetary policy mistakes, investors overpaying for growth are getting stung as well, while the Democratic Party got hurt in the off-year election and the midterms are likely to inflict more pain. The political process appears to be shutting down the fiscal largesse, but if the Fed isn’t careful, and inflation doesn’t recede below 4%, rich equity valuations will come under sustained pressure.
Stocks are Rich, Bonds are Richer
Monetary policy is widely accommodative in the hottest inflationary environment since the early ‘80s, however the unexpected contributor to financial sector liquidity in early 2021 was the Treasury. The Treasury flooded the system with liquidity by draining their account at the Fed (TGA), at first by direct transfers (checks) to the public that not coincidently coincided with speculative fervor from retail investors, and later by reducing Treasury Bill issuance that led to an insatiable demand from banks for Treasuries and mortgages. The injection of $1.6 trillion was larger than Fed new purchases, though when combined with reinvestment, which in the case of agency mortgage-backed securities is larger than new purchases, the Fed and Treasury injections caused bank cash assets to swell from $1.1 trillion to $3.0 trillion and Fed’s Reverse Repo Facility (RRP) to increase from zero to $1.6 trillion. When the Fed ended their exemption of cash and Treasuries from the supplementary leverage ratio (SLR) due to political pressure from misguided progressives in the Senate, the banks were forced to issue large amounts of debt. With tepid loan demand early in 1H21, the proceeds largely were invested in Treasuries. In short, despite rising inflation that boosted breakeven inflation rates, demand for nominal Treasuries held down yields and led to record low for real rates (TIPS yields). Equities are real assets, book value rises over time with the general level of prices, while Treasuries are nominal assets (other than TIPS). With 10-year real rates below -1% and earnings growth of 34%, the equity risk premium widened. On a standalone basis stocks are rich, but only because real rates are at historically low levels primarily due to monetary and fiscal policy.
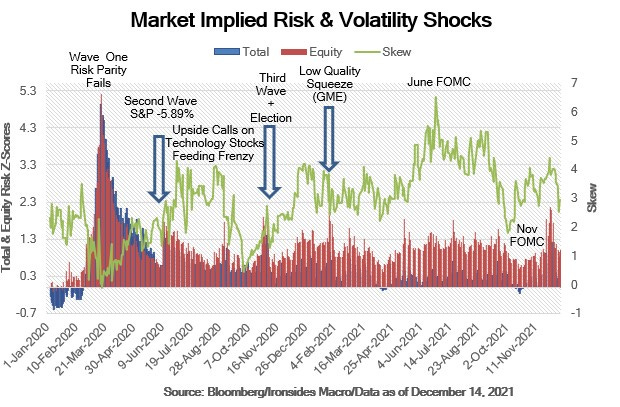
There was a series of interesting market events. What the press referred to early in the year as meme stock mania or Reddit frenzy was actually similar to the low-quality stock rally in 2003 after the technology stock bear market ended. It was primarily a short squeeze of stale positions. As the year rolled on there were a series of corrections in speculative assets such as crypto, SPACs and richly valued technology companies (the ARK Innovation ETF is a good proxy) which got hit in February, May and November/December. Throughout the year, despite several periods of very low realized volatility for the S&P 500, implied volatility, the volatility of volatility, the premium for out-of-the-money options (skew) remained higher than it was during the second half of 2020. There are several plausible explanations, and one we are partial to is that large-scale asset purchases and synchronized global monetary policy suppresses fixed income and exchange rate volatility, leaving equities as the only escape value for volatility. Another reasonable explanation is the abundant liquidity environment led to overvalued option prices, like most other financial assets. We expect prices to cheapen in 2022.
With the exception of our risk reduction call in the summer we stuck with our reflation theme and remain overweight. With the exception of parts of the industrial sector, the earnings recovery was strongest in reflationary sectors. With one quarter remaining, financial sector earnings expectations for 2021 increased 49%, materials 51%, energy 229% and small caps 33%, all stronger than the 29% increase for the S&P 500. Although we had the reflation call correct, we were positively surprised on inflation and margins. Consequently, our conviction that the ‘20s will be a reflationary regime strengthened. The sectors most heavily weighted with technology companies, consumer discretionary (27%), communication services (31%) and information technology (34%) all continued to deliver solid growth thereby justifying our market weight position. Our big miss was the real estate sector. We incorrectly viewed it as a bond proxy, but the sector had a robust earnings recovery of 33% and was generally viewed as an inflation hedge.
We had an enjoyable year; we hope you liked the notes and podcasts and found them helpful in your investment process. As always, we are very open to suggestions.
Barry C. Knapp
Managing Partner
Director of Research
Ironsides Macroeconomics LLC
908-821-7584
bcknapp@ironsidesmacro.com
https://www.linkedin.com/in/barry-c-knapp/
@barryknapp