2022 Outlook: Inflation Policy & Politics
Liquidity trickle, persistent pandemic effects, inflation policy & politics, another difficult year for the 60/40 asset allocation framework
Liquidity Trickle
2021 is going out like a lion after coming in like a lamb. We expect a back end loaded year for equity investors in 2022. Nominal economic output and earnings growth will exceed expectations, however liquidity conditions in 1H22 will be the antithesis of the 1H21 flood from the Treasury, Federal Reserve and Federal Government transfer payments. Rather than injecting $1.5 trillion into the banking system by draining their general account at the Fed (TGA), the Treasury will drain liquidity by increasing issuance and rebuilding their TGA balance to ~$500 billion. The Fed will end large-scale asset purchases in April.
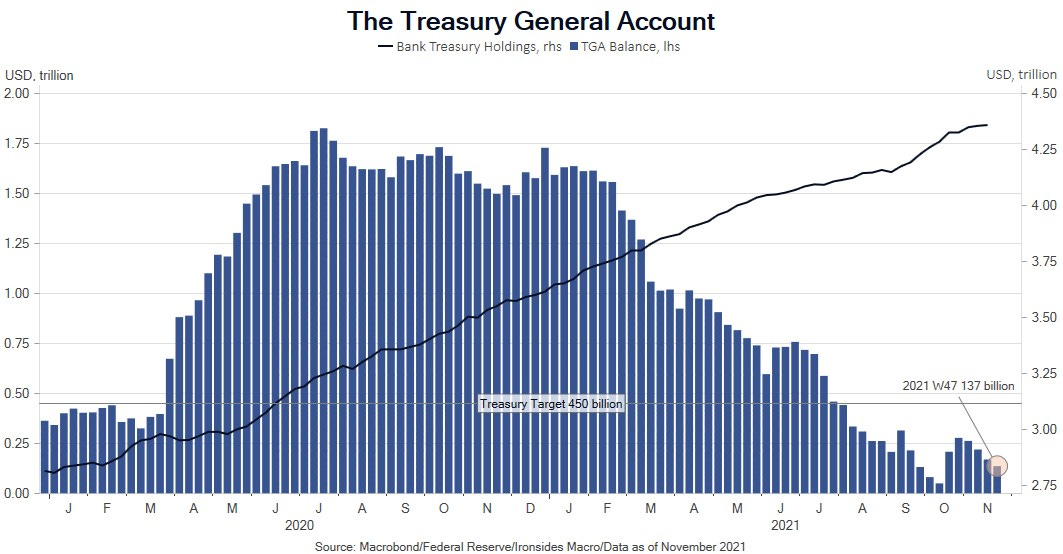
An open and important question is whether the Fed will go directly to balance sheet contraction by ending reinvestment, as Governor Waller and St Louis Fed President Bullard have suggested. We expect the end of zero rate policy by June and they will likely hike a total of 75bp by year-end. Unlike their attempts to end asset purchases in 2010, 2011 and 2012, significantly stronger nominal growth and the end to three decades of disinflation in goods prices will preclude policy retracements. The Fed put strike is considerably lower than during the aftermath of the financial crisis due to much stronger household balance sheets in terms of both assets and liabilities.
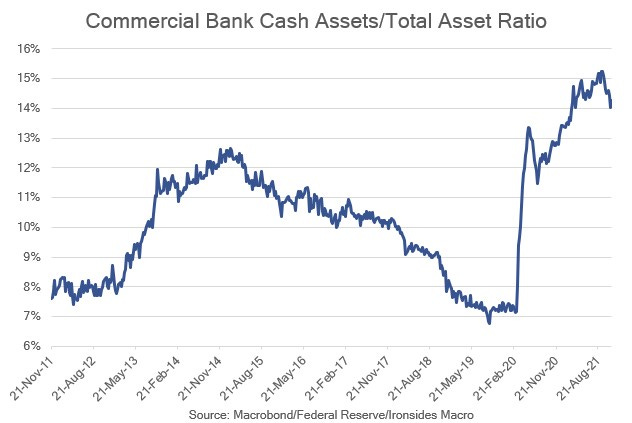
One way to differentiate between impact on the economy and financial markets of the reduced liquidity is to consider the impact on bank balance sheets. Pandemic Federal Reserve, Treasury and fiscal policies caused bank cash assets to increase from $1.1 to $3 trillion, or from 7% to 15% of assets. Securities holdings increased from 17% to 22% and loans fell from 60% to 50% of assets. Needless to say, cash and securities are far less profitable than private sector loans. Consequently, the removal of a portion of this cash and asset mix shift to loans from Treasuries will boost return on assets. In short, while a portion of this liquidity was trapped in the system back at the Fed in the reserve repo program earning 5bp, the removal may negatively impact financial markets but the impact on the real economy might even prove constructive due to better bank profitability. The recent carnage in high multiple ‘story’ stocks likely reflects reduced liquidity. Reduced liquidity is a recipe for multiple compression. While we expect 15% earnings growth in 2022, US equity returns will lag and could reach double digits by year-end, but only marginally.
Persistent Pandemic Effects
Global trade growth slowed notably in the ‘10s to 3.1% from 6.9% during the ‘00s and 7.7% in the ‘90s expansions. Global industrial production growth slowed as well from 3.6% in the ‘90s and 3.8% in the ‘00s to 2.4% in the ‘10s. The ratio of trade relative to industrial production can be considered a globalization proxy, and that ratio was 2.2 in the ‘90s, 1.8 in the ‘00s and 1.4 in the ‘10s. Factors contributing to slower global integration of supply chains were rising transportation costs, productivity adjusted labor cost convergence (faster growth in the developing world and wage disinflation in the developed world), increased exchange rate volatility and a series of supply chain shocks.
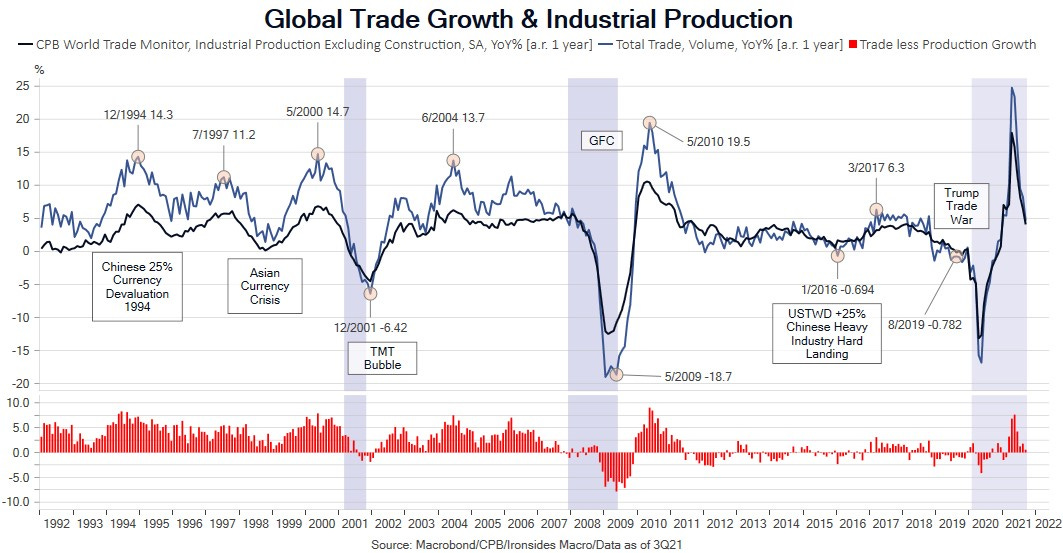
The history of US trade (see “Clashing Over Commerce”, Doug Irwin) made the ascendancy of Donald Trump inevitable. During the ‘50s and ‘60s the rebuilding of Japan and Germany led to trade deficits, and their unwillingness to adhere to the terms of Bretton Woods and revalue their exchange rates eventually led to an end to the dollar/gold standard. The admittance of China to the WTO in 2001 under the thesis that they would respect WTO rules that western nations struggle to comply with was always fanciful. Like the Bretton Woods era, the US bore the costs of expanding global trade. The resulting trade war led to a global trade and manufacturing recession, and just as the US and China reached an armistice agreement (not a treaty), the mother of all supply shocks hit. For decades the only persist sources of disinflationary pressure were goods prices, consequently, when the pandemic supply chain disruption tsunami washed ashore, those that thought the inflation shock would be transitory were ignoring the compelling economics of structuring global supply chains that were in place pre-pandemic.
The second shock runs in the other direction in terms of price effect. After a decade of strong investment in digitization and substituting capital for labor as labor slack diminished, service sector productivity growth drove a recovery in labor productivity from 1% for the first 8 years of the post-financial crisis expansion to nearly 2%. The pandemic accelerated technology innovation adoption in the delivery of both goods and services, or in other words, creative destruction. We expect it to be increasingly evident in 2022 and 2023 that productivity growth will run at least twice as fast as the post-financial crisis period. This is positive for margins and real wage growth, however we have one note of caution for the disinflationists. The sectors that have been the biggest drag on productivity and have had price gains above trend inflation for decades — healthcare, housing and education — will be most resistant to innovation, largely because of government’s outsized role in each of these sectors. The only thing transitory about inflation in 2021 was disinflation in housing, healthcare and education.
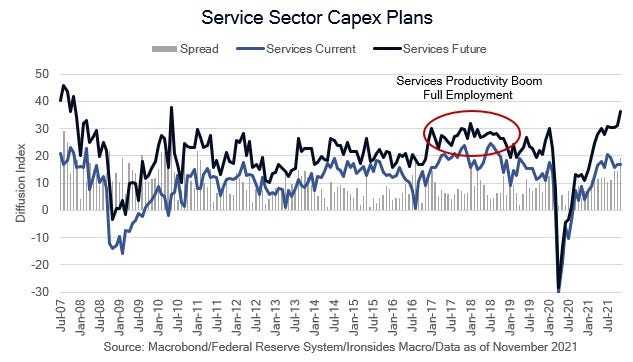
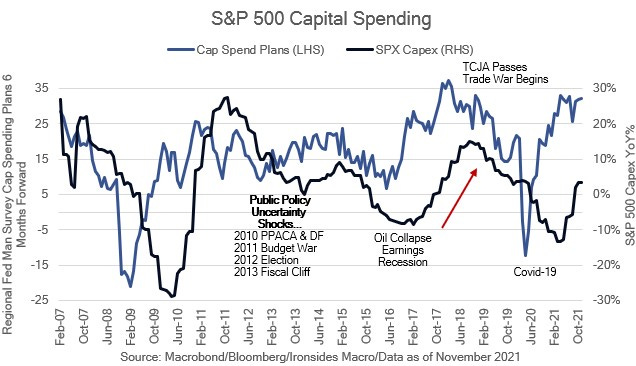
Both the deglobalization and productivity pandemic shocks imply a strong capital investment cycle. We expected increasing evidence of a strong capital investment cycle to be evident in 2H21 and we have not been disappointed. The biggest risk was a reversal of the tax incentives from the Tax Cuts & Jobs Act, and though the reconciliation bill remains a work-in-progress as of this writing, it appears that the damage will not be terminal to our thesis.
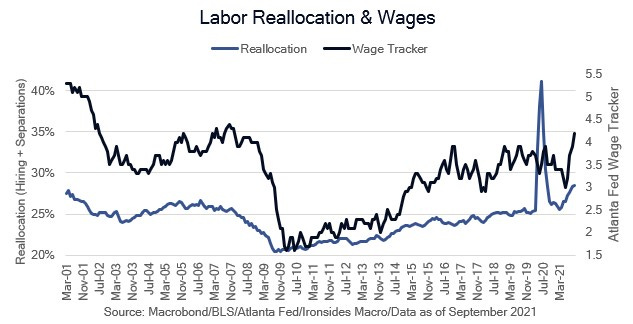
As the China labor shock receded, a decade of falling US labor market fluidity reversed, albeit slowly at first. A key component of our forecast for faster productivity growth is a more dynamic labor force. New business formation exploded during the pandemic, employment identification number applications averaged 105,000 per week in 2021, 84,000 per week in 2020, up from a stable rate of 65,000 from 2017 through 2019. Worker reallocation, the quarterly sum of hiring and separations as a percent of the labor force, was 28.4% in September, back to levels reached at the end of the ‘90s expansion. There is a strong relationship between reallocation and real wage growth, therefore it stands to reason that a dynamic labor market increases labor productivity.
Inflation: Policy Action & Political Reaction
As consumption rebalances to the pre-pandemic mix of goods and services inflation will ease, but it will be clear that pandemic policies structurally increased trend inflation in services due largely to diminished labor slack. This realization will intersect with consumer confidence surveys that have been weak as a consequence of rising inflation expectations. These surveys are not useful in forecasting consumption, but they are very useful for projecting election outcomes. This is a toxic combination for the Democratic Party’s prospects for the midterms. Lost following the surprising Georgia Senate runoff elections was Republican down ballot success, the 2021 off-year elections continued the trend towards the GOP and historical the historical pattern of the first term president losing ~26 seats in the House all point to a repeat of 2010 and 1994 when Republicans decisively captured control of the House. This will put an end to the expansion of the public sector and investor unfriendly tax policy. One cautionary note: even if the GOP also takes over the Senate, they will not be in a position to change the trajectory of regulatory policy. There are several major unsettled financial sector regulatory questions, including the supplementary leverage ratio, the countercyclical capital buffer, the head of the OCC and Federal Reserve Vice Chair for Bank Supervision. The narrow Democratic majority seems likely to preclude Senator Warren’s suggestions, consequently we do not expect regulatory tightening that would significantly impair profitability. One final point, we do not expect sector performance to reflect a potential GOP takeover of the House and more investor friendly policies until Labor Day.
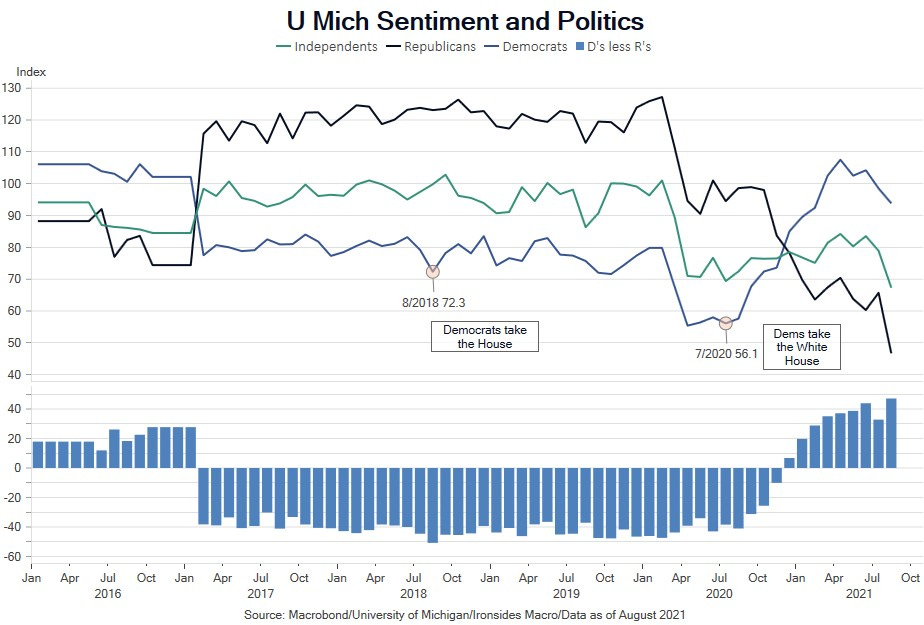
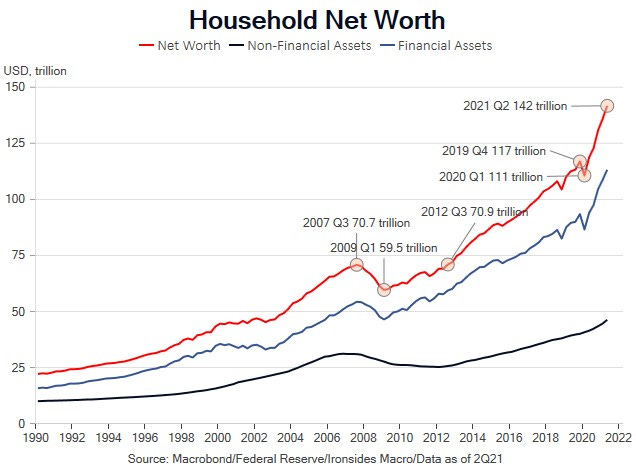
The politics of inflation shifted the outlook for monetary significantly in recent months. It seems likely the Biden Administration preferred Lael Brainard, but inflation concerns in the Senate led to Powell’s reappointment. Nonetheless, while the Administration appears to support tighter policy and the Fed is likely to oblige, the longer-term policy outlook is for an interventionist Fed that places a heavier weight on the employment mandate and is unwilling to lean against expansive fiscal policy. For 2022, there will be a couple of opportunities for risk-off episodes related to policy normalization. The end of the taper and liftoff from zero rates are both likely to cause uncertainty shocks. Additionally, we do not expect the Fed to be as sensitive to asset prices as was the case in the aftermath of the financial crisis. Household wealth fell from $70.7 trillion in 3Q07 to $59.5 trillion to 1Q09 and didn’t recover until 3Q12. During the pandemic there was a one quarter 5% decline to $111 trillion, the current level is $142 trillion. This is not to say the Fed will not react to sharp declines in asset prices, but the Fed put strike is likely to be significantly lower than down 10-15% on the S&P 500. Additionally, we expect a much higher terminal policy rate than either the Fed or markets expect.
There are several elements to this view; first, the prior cycle peak of a 2 1/2% policy rate did not slow interest sensitive sectors (housing activity did slow in 2018, but not due to rates, instead it was tax reform); the Fed reduced rates due to the trade war and later the pandemic. Additional factors that argue for a higher terminal funds rate are higher trend inflation, faster productivity growth, higher demand for capital and demographics (less developing world cheap labor and a smaller US cohort in the savings stage of lifecycle consumption). One final factor is a much stronger outlook for personal consumption expenditures relative to the first five years following the financial crisis when household assets were impaired, and liabilities were at record levels. Consumption averaged 1.8% during the recovery until mid-2014, for the second half of the expansion it averaged 3%, close to the post-war average of 3.4%. The consumption outlook for the ‘20s expansion is much stronger due to soaring assets and debt levels relative to disposable income at early ‘00s level and record low financial obligations ratios (interest payments/disposable income). One final point, some economists, strategists and investors have called for a lower terminal rate because the US is a ‘highly leveraged’ economy. While this is true in terms of aggregate levels of debt, private sector debt has fallen considerably since the financial crisis and far below thresholds that impair growth. High government debt is inflationary, high private sector debt is deflationary.
Another Difficult Year for the 60/40 Model
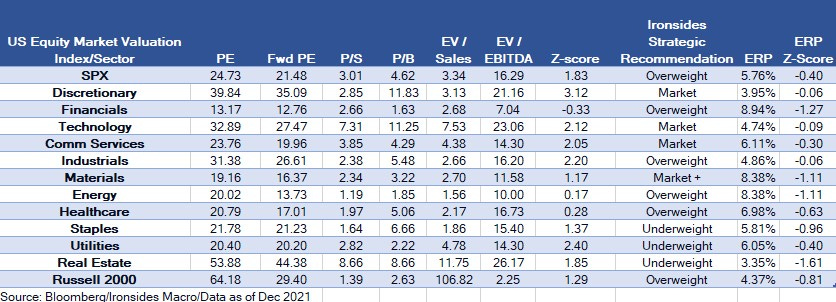
We expect a negative total return for the Bloomberg/Barclays/Lehman US Aggregate Index in 2022 and a low double digit, back-end loaded, return for US equities. We expect outperformance of reflation sectors, however there is likely to be a series of pullbacks due to monetary policy tightening and margin concerns, similar to financials in 2019 when yield curve flattening caused corrections that were more than offset following very strong earnings results. The technology, consumer discretionary and communications services sectors will struggle with a series of cross currents. The withdrawal of liquidity implies that the highest valuation companies (some software, EVs, more speculative crypto, SPACs, etc.) will underperform. Big tech, with high total yields (buybacks plus dividends), do have some bond-like characteristics for investors and in some cases, there may be some loss of fundamental momentum as the consumption mix shifts from goods to services. On the plus side, capital investment and restructuring of global supply chains imply strong demand for semis and software. We continue to expect the benefits from digitization and migration to the cloud to migrate from the producers of technology to the consumers, but this is an evolutionary process. At the sector level we remain market weight, we will likely make recommendations at the S&P industry level in 2022 due to these crosscurrents.
One of our long-standing underweights are the export dependent economies. As supply chains slowly normalize in 2022, we expect it to be increasingly obvious that the Mercantilist economic models favored by China, Japan and Germany will struggle through the ‘20s. We will look for signs of economic rebalancing and investors fully discounting their diminished outlook. We are not ready to remove our underweights, they still look like value traps, but there may be a point in 2022 to add exposure.
We got the dollar call wrong in 2021; we thought an early year rally would reverse as the pandemic receded and ultra-accommodative policy in Europe and Japan would prove counterproductive by impairing credit creation. Additionally, we expected a renewal of trade tensions to develop with exchange rate policy targeting by the ECB and BOJ a component of the tension. We haven’t given up on this thesis, it was likely pushed back though we would not place much weight on it as a factor in global equity allocation.
The Biggest Risk: Straight to the ‘70s
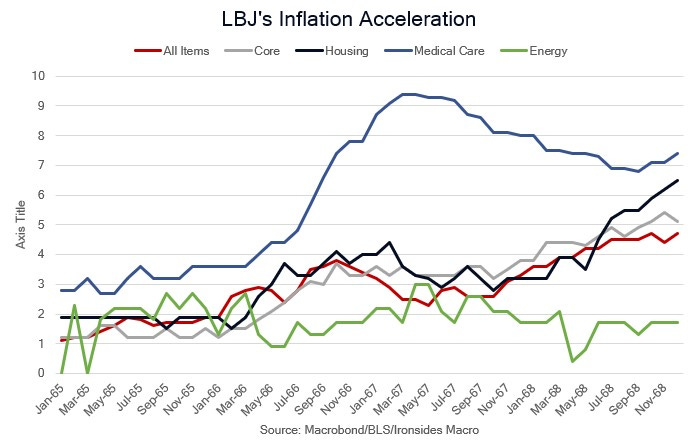
We first wrote about the ‘60s analog in our 2021 thematic investing outlook. While the current policy mix, simultaneously expansive fiscal and monetary policy, are similar to both the Kennedy and Johnson Administrations, Kennedy’s supply-side tax policy was like the Tax Cuts & Jobs Act and Biden’s focus on the social safety net is closer to LBJ’s policies. During the Kennedy Administration inflation was stable, then it accelerated during the Johnson Administration led by healthcare and housing, sectors that were profoundly impacted by LBJ led legislation. The supply shocks (energy) came during the Nixon Administration. Consequently, one possibility, not our base case, is that as the supply shock recedes, we discover that that policy intervention has set healthcare, housing, education and energy on a significantly higher trajectory like the late ‘60s, and further, that the pandemic supply shock has a similar effect as the OPEC embargoes when higher energy prices were passed through to other goods and services through expectations.
In Jeremy Rudd’s paper on inflation expectations, he considers the possibility that 4% is an important threshold. While we are above that level now, embedded in our reflationary regime theme is an expectation that trend inflation as pandemic effects recede will settle at or below that level. Inflation moving from below 2% to 4% implies strong corporate operating leverage and nominal wage growth that drives robust household spending. When the trend exceeded that level in June 1968, the longest business cycle on record at that time, ended 18 months later. The enormity of the fiscal and monetary policy intervention, much of which had little to do with the pandemic, argues for a boom/bust short business cycle. This is serious business for the Fed, in the late ‘60s they lacked the political will to offset LBJ’s War on Poverty and in the ‘70s capitulated to Nixon’s ill-advised wage and price controls.
“You never want a serious crisis to go to waste. And what I mean by that is an opportunity to do things that you think you could not do before.” Rahm Emanuel
Key Investable Themes & Beneficiaries:
Capital Spending Boom: Industrials, Semis, Software
Reflation: Materials, Financials, Energy, Small Caps, Inflation Breakevens, Short Duration, Yield Curve Steepeners, Long Fixed Income Volatility (PFIX)
Overweight US equities, underweight export dependent economies (China, Germany, Japan)
Overweight equities, underweight fixed income, use cash as your risk reducer
Barry C. Knapp
Managing Partner
Director of Research
Ironsides Macroeconomics LLC
908-821-7584
bcknapp@ironsidesmacro.com
https://www.linkedin.com/in/barry-c-knapp/
@barryknapp
This institutional communication has been prepared by Ironsides Macroeconomics LLC (“Ironsides Macroeconomics”) for your informational purposes only. This material is for illustration and discussion purposes only and are not intended to be, nor should they be construed as financial, legal, tax or investment advice and do not constitute an opinion or recommendation by Ironsides Macroeconomics. You should consult appropriate advisors concerning such matters. This material presents information through the date indicated, is only a guide to the author’s current expectations and is subject to revision by the author, though the author is under no obligation to do so. This material may contain commentary on: broad-based indices; economic, political, or market conditions; particular types of securities; and/or technical analysis concerning the demand and supply for a sector, index or industry based on trading volume and price. The views expressed herein are solely those of the author. This material should not be construed as a recommendation, or advice or an offer or solicitation with respect to the purchase or sale of any investment. The information in this report is not intended to provide a basis on which you could make an investment decision on any particular security or its issuer. This material is for sophisticated investors only. This document is intended for the recipient only and is not for distribution to anyone else or to the general public.Certain information has been provided by and/or is based on third party sources and, although such information is believed to be reliable, no representation is made is made with respect to the accuracy, completeness or timeliness of such information. This information may be subject to change without notice. Ironsides Macroeconomics undertakes no obligation to maintain or update this material based on subsequent information and events or to provide you with any additional or supplemental information or any update to or correction of the information contained herein. Ironsides Macroeconomics, its officers, employees, affiliates and partners shall not be liable to any person in any way whatsoever for any losses, costs, or claims for your reliance on this material. Nothing herein is, or shall be relied on as, a promise or representation as to future performance. PAST PERFORMANCE IS NOT INDICATIVE OF FUTURE RESULTS.Opinions expressed in this material may differ or be contrary to opinions expressed, or actions taken, by Ironsides Macroeconomics or its affiliates, or their respective officers, directors, or employees. In addition, any opinions and assumptions expressed herein are made as of the date of this communication and are subject to change and/or withdrawal without notice. Ironsides Macroeconomics or its affiliates may have positions in financial instruments mentioned, may have acquired such positions at prices no longer available, and may have interests different from or adverse to your interests or inconsistent with the advice herein. Ironsides Macroeconomics or its affiliates may advise issuers of financial instruments mentioned. No liability is accepted by Ironsides Macroeconomics, its officers, employees, affiliates or partners for any losses that may arise from any use of the information contained herein.Any financial instruments mentioned herein are speculative in nature and may involve risk to principal and interest. Any prices or levels shown are either historical or purely indicative. This material does not take into account the particular investment objectives or financial circumstances, objectives or needs of any specific investor, and are not intended as recommendations of particular securities, investment products, or other financial products or strategies to particular clients. Securities, investment products, other financial products or strategies discussed herein may not be suitable for all investors. The recipient of this report must make its own independent decisions regarding any securities, investment products or other financial products mentioned herein.The material should not be provided to any person in a jurisdiction where its provision or use would be contrary to local laws, rules or regulations. This material is not to be reproduced or redistributed to any other person or published in whole or in part for any purpose absent the written consent of Ironsides Macroeconomics.© 2021 Ironsides Macroeconomics LLC.


