

The Unforgettable Year in Review
B.C. (Before Covid), regulatory policy worsened the panic, dynamism, the recovery playbook and the wall of worry

This is the final note of our three-part outlook note series. We began with 2021 Outlook: Creative Destruction where we described three tailwinds and a looming policy risks that point to a generally favorable outlook for equities and risky assets generally for 2021. The second note, Macro Trends for 2021 & Beyond, covered five macro themes we expect to persist through the business cycle. This note is our year-in-review note, a tradition we began in the early ‘10s when we were head of equity portfolio strategy at Barclays Capital. We call our product “It’s Never Different This Time” because we believe you don’t know where you are going if you don’t know where you’ve been. Additionally, we hope those of you who write year-end summaries of your investment management performance will find this note helpful. We are making this note available to both our free signups and paid subscribers in hope you’ll consider subscribing in 2021.
B.C. (Before Covid)
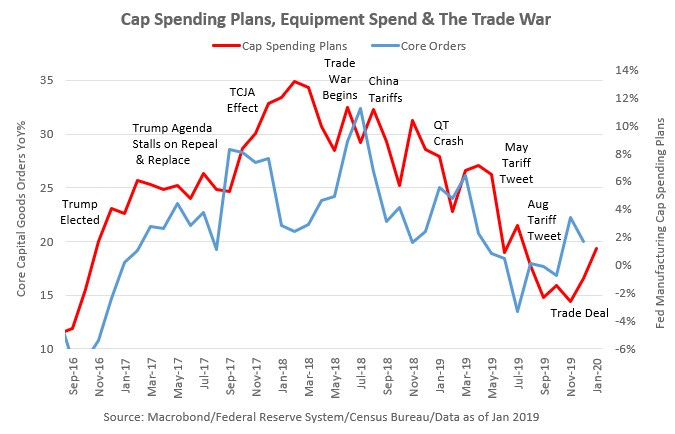
In August 2018, when the Treasury yield curve inverted, the pervasive narrative was that a US recession was likely. In our view, the inversion of the curve reflected a recession in global trade and manufacturing due to the supply chain disruption resulting from the Trump Administration’s 25% tariffs on the majority of Chinese imports. Since the global financial crisis, supply of dollar denominated 'safe' assets grew dramatically as did the supply of trade credit denominated in dollars. Consequently, as global trade growth contracted for the only time when world GDP was positive since China was integrated into global supply chains in the early ‘90s, demand for dollar assets and trade credit was the primary catalyst for the curve inversion. For most of 2019, the Treasury curve and longer-term rates were stable, most of the flattening occurred following the tariff tweets on May 5th and August 2nd. As trade tensions eased and an agreement was reached late in 2019, the curve steepened, business confidence recovered leading us to expect a sharp recovery in global trade and US capital investment. Domestic growth accelerated from trend growth of 2-2 1/4% for most of the ‘10s, to 3% in 2018 after the passage of the Tax Cuts & Jobs Act boosted business confidence, investment increased, greater labor market dynamism boosted real wage growth and productivity, only to slip back to 2% in ‘19 during the trade war. We expected a rebound to 3% in 2020 before the pandemic struck. Our primary concern for investors was a policy normalization risk-off episode in April/May when we expected the Fed to slow their $60 billion per month of bill purchases intended to boost bank reserves and smooth the functioning of the overnight lending market.
The Pandemic Crash
There were three distinct stages to the one-month 35% plunge in the S&P 500, the first stage focused on global supply chain disruption following China’s non-pharmaceutical interventions (NPIs). When Italy enacted NPIs and infections appeared in the US, the outlook darkened for consumer spending and consumer related stocks plunged. The final stage was the failure of risk parity when Treasuries and equities prices fell sharply as demand for cash surged and post-financial crisis regulatory policy intended to reduce risk in the banking system exacerbated the decline. During the initial stage we argued that global supply chains had been hit by a series of shocks beginning with the 2011 East Japan earthquake and tsunami and more recently the trade war, consequently they were likely to prove more resilient and rebound more quickly than the market expected. During the consumption phase we pointed out that the household sector had been reducing leverage since the financial crisis and was in a much better position to absorb the pandemic shock than the global financial crisis.
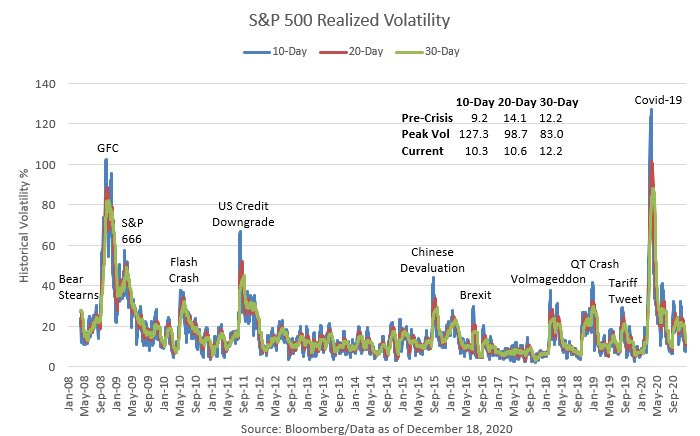
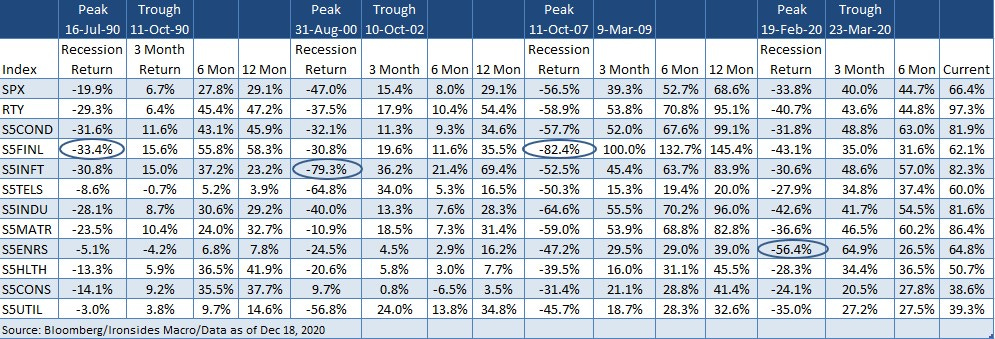
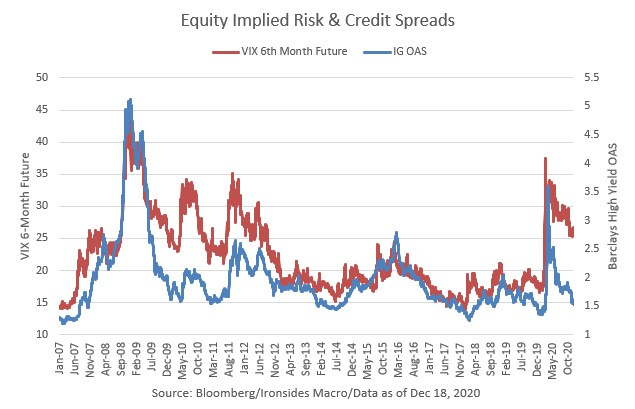
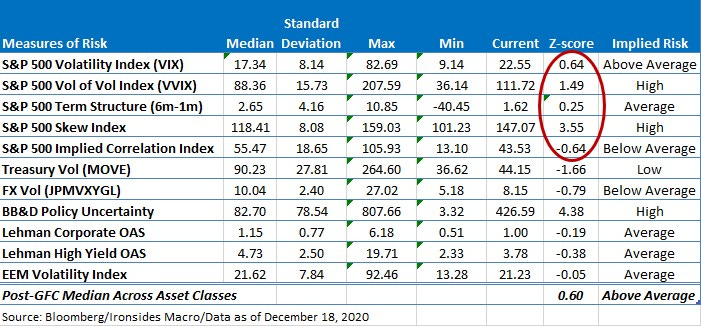
The final impulsive stage was reminiscent of numerous post-financial crisis ‘volatility of volatility’ shocks including the Flash Crash in 2010, US credit downgrade in 2011, Taper Tantrum in 2013, end of QE in 2014, Chinese devaluation in 2015, end of zero rates in 2016, Volmageddon and the QT Crash in 2018. Regulatory policy intended to reduce risk in financial institutions with FDIC insured deposits did not eliminate the risk, while the risk did shift to less leveraged entities thereby lowering the aggregate amount of risk in the system, however a side effect was transitory shocks as those entities did not have the same degree of flexibility to deal with volatility spikes. In other words, volatility was generally lower, but the volatility of volatility was higher than pre-financial crisis. Consequently, equity market measures of risk exceeded financial crisis highs until massive Federal Reserve interventions stabilized the Treasury and agency mortgage-backed securities markets. In addition to the Fed response, we suggested in early March that a fiscal response was likely despite election year politics, however the size, scope and speed of the Cares Act exceeded our expectations. The bipartisan fiscal response to the pandemic was an early sign that the partisan political contentiousness was peaking and the public was looking for more centrism.
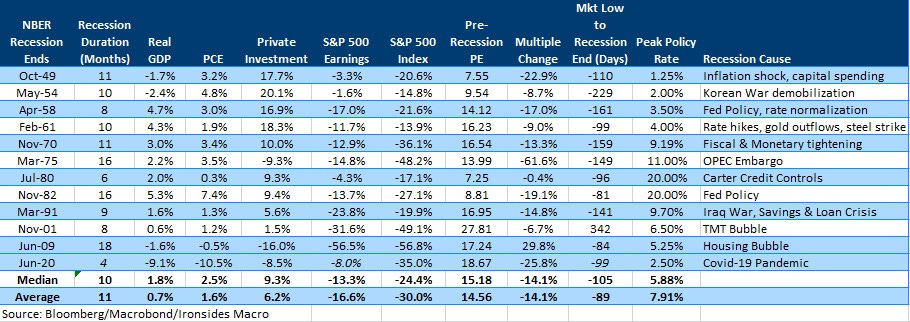
With our measures of risk at levels implying extreme bearish and our analysis of the macroeconomic implications of NPIs implying a smaller than expected effect, we turned to history for guidance of the timing and magnitude of the equity market decline. The ‘sudden stop’ recession was not unprecedented, GDP dropped 10% during the Asian Flu outbreak in 1Q58, Manufacturing ISM dropped from 50 in February 1980 to 29 in May after the Carter Administration enacted credit controls, and the ‘91 recession triggered by Iraq’s invasion of Kuwait was brief as well. The ‘80 analog is particularly compelling given that the policy reaction to inflation and in ‘20 the pandemic, cost the incumbent president the November election. After researching the duration of NPIs during the Spanish Flu, we determined that the economy would likely begin recovering by the beginning of 3Q20 implying the market should bottom in late March. Additionally, we viewed a third of the ‘20 drop attributable to the regulatory policy exacerbated volatility shock. Consequently, we had a larger than average decline, a larger than average multiple contraction, we expected the recession to be the shortest on record, the timing was right for a market bottom and measures of market risk were at all-time highs. We took a stand and recommended buying equities the weekend before the Monday March 23rd low. On Monday morning we put our money to work in software and healthcare, two industries integral to our pre-pandemic outlook for faster productivity growth, a trend we expected to be turbo-charged by the pandemic. As the week progressed it became clear that the rate of change of global new cases was peaking, this pattern reoccurred in late June during the second US wave in the Sunbelt and late October during Europe’s second wave.
Labor Market Dynamism Surprises the Econtants
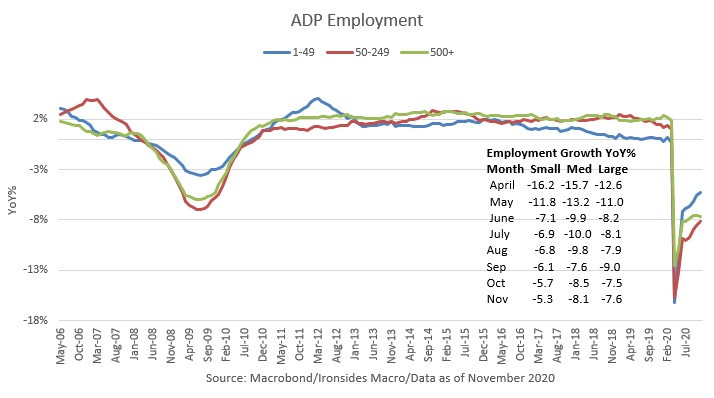
During the most acute phase of the crisis, the quest for real-time data focused on the sectors most impacted, leisure and hospitality, retailers and construction. Those sectors had been a focus of our work on labor market dynamism since Davis and Haltiwanger introduced their worker reallocation model at the 2014 Kansas City Fed Jackson Hole symposium. Turns out the sectors most impacted were the most dynamic, highest turnover sectors. They were also the target of the effective PPP program. In other words, these were the employers and employees most accustomed to chaos. That notwithstanding, waiting for the JOLTS report was not going to be of any use for investors during the pandemic. Instead, we created a back-to-work proxy using the cumulative increase in initial jobless claims less continuing claims. Initial claims measure job separations, the narrative that there were 30, 40, then 50 million newly unemployed even after continuing claims began to contract, omitted rehiring. This led us to a call ahead of the May employment report that hiring would turn positive by June and expectations for a 7.5 million decline were too pessimistic. Of course, that report was likely the largest positive economic surprise ever when jobs increased by 2.5 million. For investors, the recession ended on March 23rd, for economists (not econtants) it was over when the May employment report was released on June 5th. This pattern continued for subsequent employment reports. Seasonal adjustment factors skewed the weekly claims numbers negatively through the summer until the Bureau of Labor Statistics changed their methodology and throughout the pandemic market participants overestimated the impact of NPIs on aggregate economic activity as the 16% of total employment but only 6% of income from the leisure & hospitality sector never seemed to resonate with the econtants. One note on the unique psychology of the pandemic, in several cases following media appearances we received vitriolic feedback after bullish market outlooks. The combination of financial and health risks created perhaps the largest ‘wall of worry’ in our four decades in the markets.
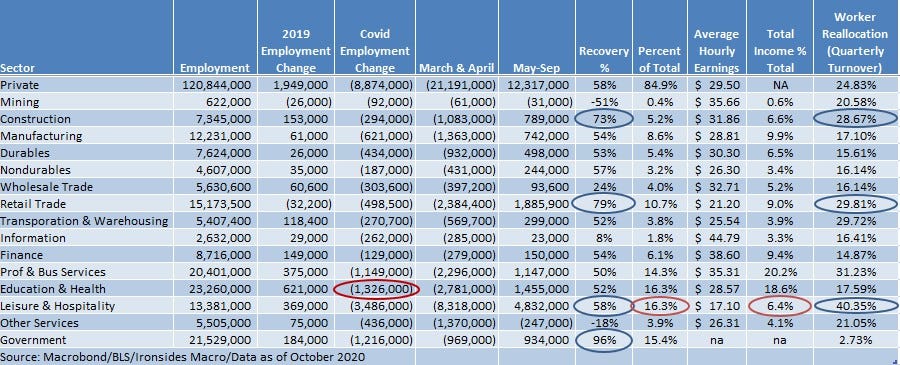
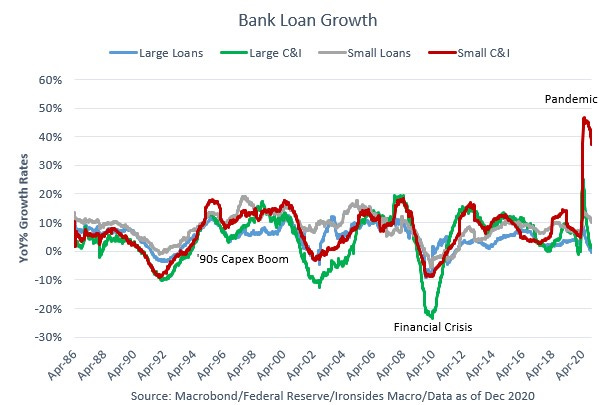
Another important illustration of labor market dynamism was the faster recovery for small businesses. Initially, we attributed the recovery to the PPP program and research on the Treasury’s website provides support for that view. Even after new loans were no longer available, the faster recovery in small businesses continued. Additionally, applications for new business identification numbers jumped to all-time records and are currently running 38% above a year ago.
The Recovery Playbook
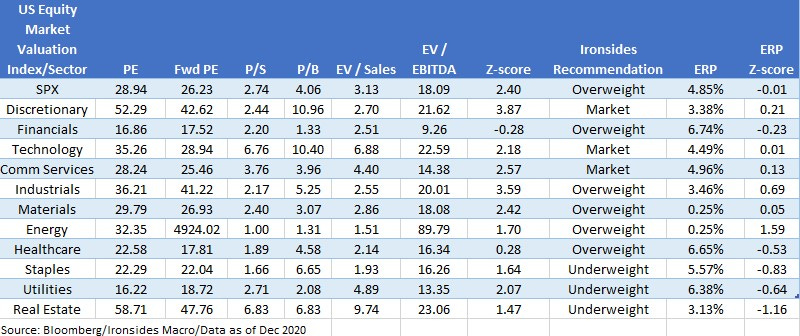
In the early stages of the recovery we recommended a Schumpeter’s Gale approach, in other words buy sectors where preexisting trends were accelerated by the pandemic including software and healthcare. By late April in The Corona Recovery Playbook, we recommended a traditional recovery sector bias; small caps, consumer discretionary, financials, technology and materials. Our underweights were defensive sectors; staples, utilities and REITs. In the summer we swapped industrials for consumer discretionary due to the condensed nature of this cycle and our view that the recovery in manufacturing and related inventory restocking would be exceptionally robust given that trade war and pandemic had depressed activity since mid-2018. Despite the market focus on work-from-home relative to reopening and growth vs. value, this cycle has followed the pattern of previous cycles. Most notably, in the first year of recoveries small cap average outperformance is 18% and though it hasn’t been a year, the Russell 2000 is 31% better than the S&P 500 from the March 23rd low.
The Tech Wreck
Just as the recession ended, a second wave struck the Sunbelt and a significant volatility aftershock occurred on June 11th. However, after a couple of weeks of market consolidation, the rate of change of Sunbelt cases peaked, 2Q20 earnings blew away expectations and economically sensitive cyclical stocks began a rally that continued through the balance of the year. Before the handoff from the winner-take-most technology centric companies was complete, there was a blow off top in these names in July and August that was exacerbated by retail speculation in the options market and culminated with the Softbank ‘whale’ swapping long stock for call spreads that drove S&P 500 implied volatility and skew significantly higher even as the market rallied. This set up a September market correction that began with the technology and communications services sector. We had recommended reducing risk following 2Q20 earnings season. After recommending the technology sector for a decade we changed our recommendation to market weight in late August based primarily on our view that in the ‘20s the benefits of digitization would migrate from the producers to consumers of technology. A secondary factor is our expectation that pressure would build on Robert Bork’s “The Antitrust Paradox” thesis that the original intent of the Sherman Antitrust Act was consumer welfare. Consequently, neo-Brandeisian, named for Supreme Court Justice Louis Brandeis, also known as the ‘curse of bigness’, would reemerge and pressure the ‘winner-take-most’ technology giants. The timing of our downgrade was influenced by the speculative fervor, we also downgraded communication services to underweight though after a sharp pullback we reversed course and went to market weight on that sector as well.
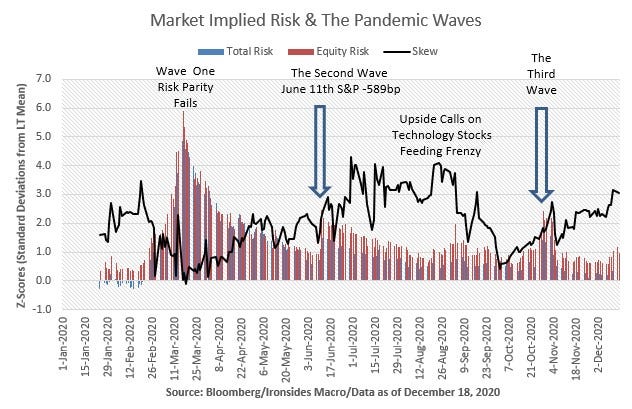
Rebuilding the Wall of Worry
After the 10% September pullback the equity market entered a range between the early September low and late September high with S&P volatility creeping higher amidst Europe’s second pandemic wave, election related concerns of civil unrest, a blue wave and associated increases on capital gains and corporations, and rising case counts in the Midwest. These concerns crested the weekend prior to the election, however for the third time in the pandemic, the rate of change of new cases peaked just as officials enacted NPIs and the markets pivoted to risk on. The peak in Europe’s second wave case momentum was the weekend before the US election, the US public voted for a center right government at all levels of government except the Presidency. There was no civil unrest, Alex de Tocqueville was proven correct, our institutional framework held and the year-end rally began. A year ago, when we wrote our election outlook note, our core thesis was that taxpayers would push back on progressive plans for tax hikes, referendums in Illinois, Colorado, GOP success in local and national elections were consistent with our view and though Joe Biden won, his promised to raise taxes is unlikely to be kept with the latest round of polls and betting odds reducing the probability of a Democratic sweep in the Georgia Senate runoff elections to 20% in our view.
As the year draws to a close, markets are following typical seasonal patterns. Equities and commodities are rallying, Treasury yields are rising led by inflation expectations, credit spreads are tightening, and the dollar is falling against the Euro, commodity sensitive and emerging market currencies. This begs the question is sentiment sufficiently elevated to trigger a risk-off event. Generally, we view sentiment as a necessary but not sufficient condition for a correction. Given the tailwinds we covered in our 2021 Outlook, we suspect any pullbacks will prove transitory until we reach the point when the Fed is ready to normalize policy.
Barry C. Knapp
Managing Partner
Director of Research
Ironsides Macroeconomics LLC
908-821-7584
bcknapp@ironsidesmacro.com
https://ironsidesmacro.substack.com
https://www.linkedin.com/in/barry-c-knapp/
@barryknapp
This institutional communication has been prepared by Ironsides Macroeconomics LLC (“Ironsides Macroeconomics”) for your informational purposes only. This material is for illustration and discussion purposes only and are not intended to be, nor should they be construed as financial, legal, tax or investment advice and do not constitute an opinion or recommendation by Ironsides Macroeconomics. You should consult appropriate advisors concerning such matters. This material presents information through the date indicated, is only a guide to the author’s current expectations and is subject to revision by the author, though the author is under no obligation to do so. This material may contain commentary on: broad-based indices; economic, political, or market conditions; particular types of securities; and/or technical analysis concerning the demand and supply for a sector, index or industry based on trading volume and price. The views expressed herein are solely those of the author. This material should not be construed as a recommendation, or advice or an offer or solicitation with respect to the purchase or sale of any investment. The information in this report is not intended to provide a basis on which you could make an investment decision on any particular security or its issuer. This material is for sophisticated investors only. This document is intended for the recipient only and is not for distribution to anyone else or to the general public.Certain information has been provided by and/or is based on third party sources and, although such information is believed to be reliable, no representation is made is made with respect to the accuracy, completeness or timeliness of such information. This information may be subject to change without notice. Ironsides Macroeconomics undertakes no obligation to maintain or update this material based on subsequent information and events or to provide you with any additional or supplemental information or any update to or correction of the information contained herein. Ironsides Macroeconomics, its officers, employees, affiliates and partners shall not be liable to any person in any way whatsoever for any losses, costs, or claims for your reliance on this material. Nothing herein is, or shall be relied on as, a promise or representation as to future performance. PAST PERFORMANCE IS NOT INDICATIVE OF FUTURE RESULTS.Opinions expressed in this material may differ or be contrary to opinions expressed, or actions taken, by Ironsides Macroeconomics or its affiliates, or their respective officers, directors, or employees. In addition, any opinions and assumptions expressed herein are made as of the date of this communication and are subject to change and/or withdrawal without notice. Ironsides Macroeconomics or its affiliates may have positions in financial instruments mentioned, may have acquired such positions at prices no longer available, and may have interests different from or adverse to your interests or inconsistent with the advice herein. Ironsides Macroeconomics or its affiliates may advise issuers of financial instruments mentioned. No liability is accepted by Ironsides Macroeconomics, its officers, employees, affiliates or partners for any losses that may arise from any use of the information contained herein.Any financial instruments mentioned herein are speculative in nature and may involve risk to principal and interest. Any prices or levels shown are either historical or purely indicative. This material does not take into account the particular investment objectives or financial circumstances, objectives or needs of any specific investor, and are not intended as recommendations of particular securities, investment products, or other financial products or strategies to particular clients. Securities, investment products, other financial products or strategies discussed herein may not be suitable for all investors. The recipient of this report must make its own independent decisions regarding any securities, investment products or other financial products mentioned herein.The material should not be provided to any person in a jurisdiction where its provision or use would be contrary to local laws, rules or regulations. This material is not to be reproduced or redistributed to any other person or published in whole or in part for any purpose absent the written consent of Ironsides Macroeconomics.© 2020 Ironsides Macroeconomics LLC.