


Malinvestment Bust in Silicon Valley
The costs of QE, an iceberg in Silicon Valley, the root of volatility, labor supply shock

Based on feedback we received from paid subscribers and the importance of the events this weekend, we added to our section of Silicon Valley Bank and are removing the paywall.
Malinvestment
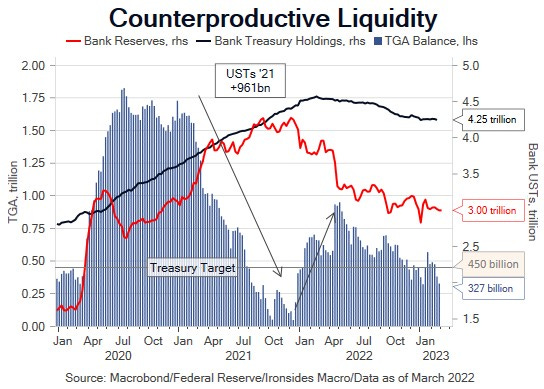
Hayek and Mises are having a laugh at Keynes expense, somewhere, somehow. We consistently asserted though the ‘10s and during the excessive pandemic policy response from monetary and fiscal policymakers that suppressing the most important price in the global markets system was causing classic Austrian malinvestment. Perhaps due to an incomplete understanding of monetarism, policymakers assumed as long as consumer price inflation was under target, large-scale asset purchases was a cost-less strategy. Those of us deep in the weeds of capital markets watched commercial real estate capitalization rates, high yield spreads, leveraged loans and CLO spreads, valuations on technology startups and Treasury bond term premiums contract to levels that made little economic sense. In 2021, convinced from the early stages of the pandemic that the disinflationary globalization regime was over, we continuously warned that the Treasury and Federal Reserve liquidity injections were counterproductive.
There is an uncomfortable parallel to Fannie Mae and Freddie Mac’s role in the Global Financial Crisis. In 2002 during former Fed Chair Bernanke’s deflation scare, Fannie ran a 25-month duration mismatch, in essence a $115 billion 10-year Treasury equivalent short position in their retained portfolio of agency mortgage-backed securities primarily because the cost of option hedges exploded during the refinancing boom. In other words, they just let their interest rate risk ride. Market participants found them out, the resultant squeeze cost them ~$5 billion. Congressional hearings led to restrictions on interest rate risk and a new regulator. Fannie and Freddie, the ultimate case of moral hazard due to the ‘not so’ implicit government guarantee, shifted their focus to credit risk. They went on to buy ~40% of the super senior tranche of virtually every subprime collateralized debt obligation (CDO) deal from 2003 to 2008 at levels barely made economic sense with 60 turns of leverage backstopped by the Federal government (Libor +10-30bp), but which helped meet their Community Reinvestment Act requirements (though the lending wasn’t as focused on disadvantaged communities as they believed). In 2011, the FHFA sued large banks for $500 billion in losses (mark-to-market, never realized) on those securities. Today, Dodd Frank and Basel capital rules have drastically reduced credit risk from the systemically important banks and pushed them into interest rate risk. We suspect the men that spurred us on, who sit in judgement of all wrong (thanks Roger and Pete for that line, we know you weren’t referring to Chris Dodd and Barney Frank, but you were prophetic nonetheless), failed to comprehend that without risk, there is no return.
We have generally been dismissive of the recession signal from yield curves anchored in the belly of the Treasury curve (5-10-years) due to rate suppression from the stock of Fed holdings. However, while the banking system generally, as well as the household, and nonfinancial corporate sectors have low levels of leverage and are not vulnerable to a deeply inverted yield curve, regulatory and monetary policy pushed maturity transformation/carry trades/borrowing short and lending long, into the nonbank system. Surprisingly, Chairman Powell reintroduced Iceberg Risk at his semiannual monetary policy report, and something immediately broke. We thought they learned their lesson in September when excessively hawkish policy led to crashes in the yen, pound, euro, yuan and mortgage-backed securities market. The February employment report showed increased supply, softer demand and most importantly, a continuation of wage disinflation. Consequently, even absent financial instability, the employment report does not justify a 50bp hike at the March meeting. The Fed is now in the quiet period, probably time for a call to the Wall Street Journal.
Until They Break Something
Venture capital is an important economic incubator for the US economy, and private equity is an important engine of creative destruction that improves economic efficiency. That said, when the Fed suppresses the cost of capital and capital pours into those sectors, the managers are faced with a choice: close the funds or put the money to work at elevated valuations. We’ve written about the coming debt maturity wall in PE, the VC trainwreck began with the closing of the IPO market and the valuation compression in the public equity market in ‘22. Silicon Valley Bank (SIVB), with $211 billion in assets using Bloomberg’s financial analysis function based on year-end 2022, was the second largest US bank failure. SIVB’s deposits tripled from YE19 through YE21, the majority of the growth occurred in ‘21 while the Treasury was injecting $1.7 trillion (sending checks and reducing issuance thereby draining their Treasury General Account at the Fed) and the Fed $1.5 trillion of liquidity (asset purchases) into the system. A related factor that pushed deposits into less sophisticated hands was the politically motivated decision to end the emergency pandemic exemption of cash and Treasuries from the supplementary ratio (SLR) in March ‘21. The largest banks began turning away large institutional deposits, banks below the $250bn threshold were not subject to SLR. This was perhaps the only emergency declaration policymakers should have extended. These excessive liquidity injections created all these deposits, if the large banks couldn’t take them, they had to go somewhere.
We spent some time looking at their balance sheet. On the surface the size of the loan book relative to the deposit base was low, however, they had one category of highly concentrated, illiquid assets, like our (Lehman) commercial real estate or Bear Stearns subprime portfolios. They also apparently had a highly concentrated deposit base and no George Bailey character to talk them out of a social media driven run. We spoke to a former mortgage trader colleague about their mortgage securities portfolio sales, and he was quite critical of the $29 billion in securities they held in their available for sale account they liquidated at a $1.8 billion loss that triggered the run due to the convexity, not credit, profile. There was $91 billion in securities in the held to maturity account and $74 billion of loans, $70 billion are categorized as other commercial loans, presumably the VC portfolio, funded by $173 billion of deposits (at year end), prior to the run. $81 billion of the deposits were demand deposits and $92 billion interest bearing, we saw a report that $151 billion were uninsured. The Bloomberg headline below quantifies the magnitude of the run that triggered the FDIC seizure. There was $16.3 billion in equity, and $5.4 billion in debt, and the senior notes were trading 37-41 late Friday. The FDIC will release the deposits below the cap on Monday and begin the resolution process. The knock-on effects on the start-up industry are unclear. As a former Lehman Brothers managing director we eschew comparisons, this was something of Silicon Valley’s Lehman moment. It is unlikely to have similar systemic effects, but it marks the end of a cycle.
SVB DEPOSITORS TRIED TO PULL $42B ON THURS, STATE WATCHDOG SAYS
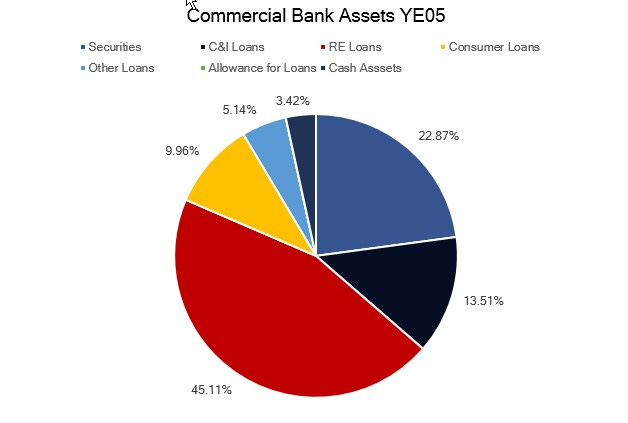
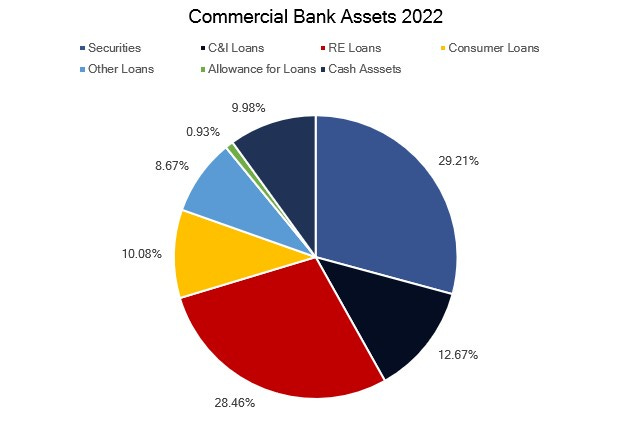

There is little dispute that the aggregate banking system assets are higher quality, and the asset/liability mix is significantly derisked, relative to the financial crisis. There is also little question that the $1.5 trillion in securities purchased in ‘21 are trading at large discounts, if they had to be liquidated the losses would be considerable. The Fed’s agency MBS portfolio is a decent proxy for large banks, it is 2 and 2.5% coupon securities that are trading at 81 and 85 respectively. We suspect in the coming days investors and depositors will look for vulnerabilities in asset concentration, and commercial real estate is an obvious place to look. We like the sector due to an improving asset mix leading to improved profitability. The securities holdings are a drag on profitability, but they are 30% of the portfolio and cash assets remain high. We suggest being greedy when others are fearful, but the Fed does need to steer away from the 120bp 3-month bill, 10-year note inverted yield curve iceberg. A word to the Fed whisperer that 50bp is off the table would help.
The Root of All Volatility
The US 30-year fixed rate prepayable mortgage, a product unique to the US, and only possible with government support, is a major contributor to global exchange rate, monetary policy, economic, and interest rate volatility. During the global financial crisis, the FOMC lowered the policy rate from 5.25% to the effective lower bound (0-0.25%) and launched their first large-scale asset purchase program. The asset purchases, like the pandemic purchases, began as a Bagehot lender of last resort tool intended to stabilize market functioning and stem a run on the banking system. As the markets stabilized in 1Q09, and the recession ended in 2Q09, it became apparent that the 30-year fixed rate mortgage, combined with negative equity for ~50% of mortgage holders, many of whom had second liens (HELOCS), left a large portion of the household sector unable to refinance. Consequently, the reduction in the policy rate, and asset purchases that lowered longer term rates, had no effect on the cash flow of a large portion of the household sector. In other words, the 30-year fixed rate mortgage reduced the efficacy of Fed policy. The effects of Fed policy easing, combined with Chinese fiscal stimulus equivalent to 25% of GDP, triggered emerging markets inflation. This led to a period of extreme capital flows volatility that culminated with the Taper Tantrum in 2013 and gave us the theme of the 2013 Jackson Hole conference, Global Dimensions of Unconventional Policy, where economists upended economic orthodoxy by calling for capital controls. It was KC Fed President Tom Hoenig’s parting gift to Chairman Bernanke, a weekend of QE critiques that likely led to the Chairman to skipping the symposium.
Dilemma not Trilemma: The Global Financial Cycle and Monetary Policy Independence
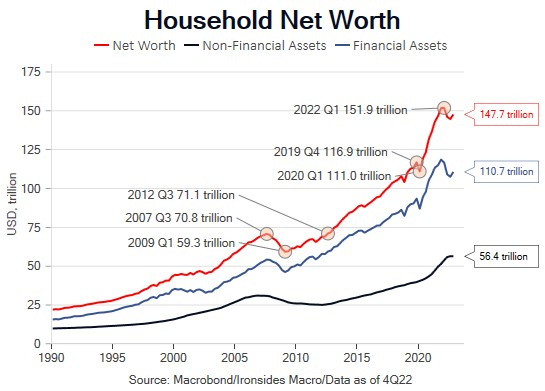
While the 30-year fixed rate mortgage led the FOMC to ease more than they might have otherwise in 2009-2013 to cushion overleveraged household balance sheets, the opposite situation exists today. Something like 90% of mortgages are fixed rate, household debt has fallen from 132% to 99% of disposable income and mortgage interest debt service from 7.2% of disposable income to 4%. Now the Fed has another issue, which is that their policy is having little effect on consumer demand. In addition to the mortgage market and deleveraged household sector, the wealth effect is fairly small (3-4% over two years, or 32bp of nominal GDP per year) and the pandemic, and policy tightening related 5% declines to household wealth were much smaller than the 16% financial crisis contraction that took five years to retrace.
This leaves the FOMC in something of a bind. If they continue to push on the household string to weaken demand for housing, then autos, services and goods, the sectors that benefited from zero rates, such as venture capital (Silicon Valley Bank) and PE real estate, will be in even deeper trouble. Additionally, if the Fed pushes too hard, exchange rates, this time in the developed world struggling with energy deficits and the dollars evolution to a petrocurrency, will destabilize as they did in September.
One final technical aspect of the 30-year fixed rate mortgage, the prepayment option, is the largest source of interest rate implied volatility globally. There are three channels for Federal Reserve large-scale asset purchases — liquidity, duration and volatility. The liquidity channel results from the creation of bank reserves when the Fed purchases Treasuries and mortgages. The Fed takes duration from the market during QE, they return duration to the market very passively with the passage of time as their Treasury portfolio matures and when mortgages are prepaid. The volatility channel is the pervasive effect of QE. This is because the Fed does not hedge prepayment (convexity risk), nor do they mark their portfolio to market and any losses are accounted for as a deferred asset. While banks can hold mortgages in their held to maturity account and account for them at cost, there is opportunity cost and negative carry effects on cash flow.
If they are forced to liquidate these assets, like Silicon Valley Bank, the losses will be considerable. Currently mortgage prepayment speeds are the slowest recorded, the Fed’s portfolio is roughly 65% 2 and 2 1/2% coupons that are currently running at a 2-3% CPR (conditional prepayment rate). In other words, the privatization of mortgage prepayment risk, and duration impact of QT, is low as evidenced by the Fed’s mortgage holdings shrinking at half of their current $35 billion monthly cap. This is a big component of the deepest inversion of the 2s10s Treasury curve since the Volcker tightening cycle, and given the level of rates, the current inversion is more extreme. When Chairman Powell answers questions about QT at press conferences and this week’s semiannual monetary policy report and says it is going well, we can only shake our head. The deep inversion, if allowed to persist, will lead to additional icebergs.

Labor Supply Recovery
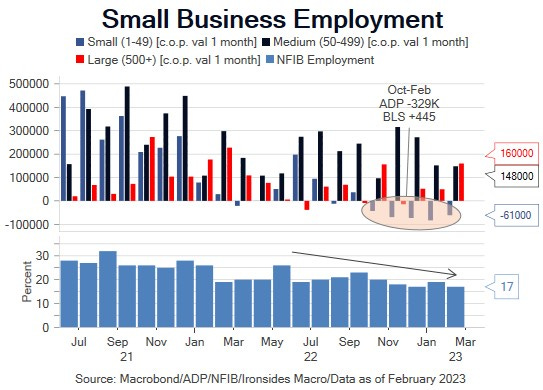
The February employment does not justify increasing the pace of rate hikes even if the Silicon Valley Bank run had not occurred. While the headline payroll gain exceeded expectations even with a negative 34,000 revision to the prior two months, the establishment series was the only demand indicator that was firm, and we are even more convinced that their small business model-based estimate is missing a major inflection point. As we expected the surge in the workweek was revised down and fell further in February returning it to the 4Q average of 34.5. The softer work week, combined with coolest average hourly earnings monthly change (0.2%) in a year, led to a resumption of the downtrend in labor income from 9.4% in January to 7.9%. The birth/death model added 176,000 jobs and has added 445,000 jobs since October while ADP small business employment contracted 329,000 declining each month over the same period, and the NFIB February Hiring Index fell from 19% in January to 17% in February extending its steady decline that began at the same time as the ADP series. Weather may have played a role in the stronger than expected headline, as those unable to work due to weather was 174,000, while the February average is 318,000.
We suspect weather contributed to construction employment gains of 24,000 in February and 35,000 in January despite the 240,000 in job openings in January. As we detailed in our February Payroll Preview, the Costanza-Phillips Curve upon which Congress based the Humphrey Hawkins dual mandate update to the Full Employment Act of 1946, actually worked this month. The U3 unemployment and U6 underemployment rates increased from 3.4% to 3.6% and 6.6% and 6.8% respectively, and headline wage growth slowed. One of the broadest measures of the strength of labor demand, the aggregate hours index contracted 0.1% and is increasing at a 1.9% quarterly annualized rate. Even using the Fed’s flawed Costanza models, this is a pace consistent with price stability.
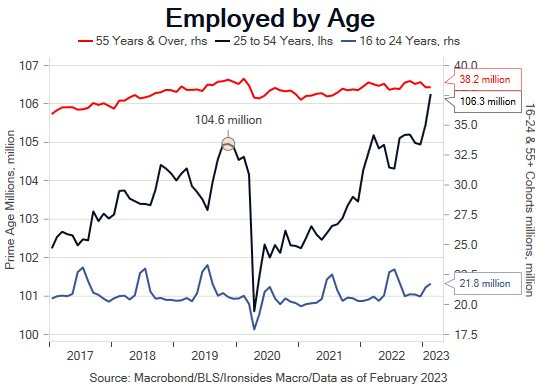
The most important element of the report was another large increase in the labor force, 419,000 following 866,000 in January. The prime age (25-54) participation and employment rates increased 0.4% and 0.3% to pre-pandemic levels. Participation in the 16-24 (higher) and over 55 cohorts (lower) offset in February, on the margin may have contributed to cooler wage growth. The surge in prime participation in recent months and an increase in immigration most certainly are a major factor in slowing wage growth.
Final Thoughts
We suggested buying call spreads on TLT, expecting softer data to lead to a countertrend rally in longer duration Treasuries. We got our rally for reasons we didn’t anticipate; we will look to unwind next week. We suggest looking for a spot to fade the VIX spike, put spread calendars (selling March, buying April) is a limited risk approach. We suggest adding to bank holdings as well. We will likely release a short note following CPI on Tuesday, on Thursday we are headed to NYC through the following week.

Key Investable Themes & Asset Allocation:
Deglobalization & Capital Spending Boom: Industrials XLI -0.14%↓
Resilient Growth: Materials XLB 0.22%↑, Financials XLF -0.97%, KRE -0.14%↓, Energy XLE -0.86%↓ XOP -0.67%↓, Small Caps IWM -0.40%↓
Technology Innovation Diffusion: Healthcare IYH 0.00, Industrials XLI -0.14%↓ and Financials XLF -0.97%↓
Global Equity Allocation: Overweight US and UK equities SPY -0.38%↓, EWU 0.00, underweight export dependent economies (China FXI -1.20%↓, Germany EWG -0.48%↓, Japan EWJ -0.34%↓)
US Asset Allocation: Overweight equities SPY -0.38%↓, underweight Treasuries TLT 1.16%↑, overweight credit LQD 0.09%↑
Tactical trades: Buy 10-year USTs for a rally to 3.5%, one approach is the April TLT 101/107 call spread.
Barry C. Knapp
Managing Partner
Director of Research
Ironsides Macroeconomics LLC
908-821-7584
bcknapp@ironsidesmacro.com
https://www.linkedin.com/in/barry-c-knapp/
@barryknapp