Iceberg Risk
Rising terminal rate, iceberg risk, disinflation in '23 intact, CBO's real risk, covering our tech short
Will the Terminal Rate Prove Terminal?
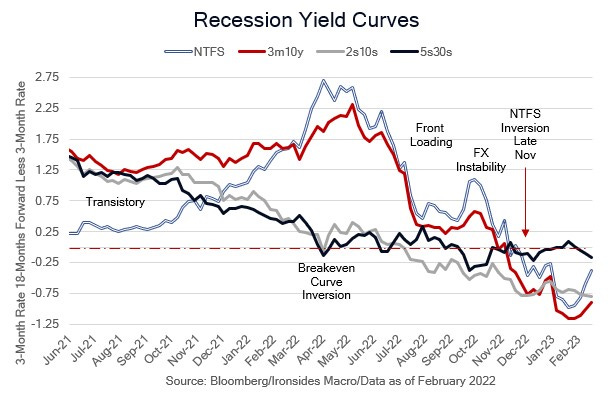
The hotter than expected CPI and PPI reports captured most of the headlines this week, however the more important reports for the outlook were retail sales, the National Association of Homebuilders Housing Market Index and another week of sub-200,000 initial jobless claims. The simplified consensus (which is not our view) equity investor 2023 outlook narrative was that 2022 was all about the market multiple contraction, and in 2023 the ‘E’ component of the PE ratio would contract sharply for rare back-to-back negative, or at best flat, returns. The fixed income implied economic outlook was similar: yield curves across a range of maturities flattened in January, most notably the Fed’s favorite recession curve, the near-term forward spread, after initially inverting in late November, deepened its inversion from ~-50bp in late December to -113bp in mid-January. The deepening curve inversion was driven by a rally in the longer duration Treasuries, exclusively due to real rates as investors expected the monetary long and variable lags to materialize in economic activity data. Specially, markets expected the effects of aggressive tightening to have a profound impact on demand for labor and consumption in 1H23.
Our economic view differed from consensus in that we thought the 2022 housing and manufacturing/inventory contractions were ending and would act as an offset to slowing income growth, leading to a 1995 post-tightening soft patch, not a recession. Our ‘natural rate’ forecast has been above consensus since before the tightening cycle began. In recent weeks the primary theme driving the entire Treasury curve higher is an increase in the sustainable policy rate. In other words, the combination of January employment, ISM Services, retail sales, manufacturing production and growing evidence of residential housing demand recovery, are all convincing markets that the real economy can withstand a 5% policy rate. Supporting this diagnosis is the near-term forward spread steepening from -113bp in mid-January to -43bp, the flattening of the fed funds curve, a 50bp steepening of the 2s10s real rate (TIPS) curve while the 2s10s breakeven curve was flattening, and stable 5y5y inflation breakeven curve. In other words, the fixed income market implied growth outlook improved without an increase in inflation expectations. These trends could change if the January labor market, retail sales and housing data turn out to have been distorted by seasonal adjustment factors and weather, and the February inflation reports lead to a repricing of inflation expectations. For now, the markets are trending towards our outlook for lower inflation through June, resilient growth, and a ‘95 environment when equities looked through the earnings soft patch as an aggressive rate hike cycle was wound down.
One final point: the earnings recession integral to the most bearish equity market outlooks was confined to technology and related sectors in 4Q22 results that are nearly complete, and as we will discuss later in the note, our leading earnings indicator, net revisions, are recovering sharply in those sectors.


