2024 Outlook: Put, Pause, Pivot
The Fed's full employment mandates slips away, and equities struggle before the pivot
2024 Outlook
Key Forecasts
Inflation: Core disinflation but only to the top of the FOMC’s 3%-2% comfort zone
Unemployment: Headed well above 4%, likely to be the trigger for the coming Fed pivot
Growth: Consumption and investment are slowing, but unlikely to go significantly negative
Earnings: Weaker than forecast 1H24, leading to mid-single digit growth, below consensus of 11%
Fed Policy Rate: First cut in March, 100bp total will stabilize the bank credit contraction
S&P 500: The first 10% move likely to be down to 4100, followed by a recovery in 2H24 to 5100
USTs: Curve disinversion by mid-year, slightly higher back-end rates at YE24
Sector Allocation: Overweight Industrials, Materials, Energy, Underweight Financials & Small Caps
A Rocky Transition to a Fed Pivot
In our 2023 outlook note, 9 to 4, but then what, we expected disinflation to act as a major tailwind for both equities and fixed income until headline inflation bottomed out with the June readings. One development we did not expect was the banking crisis in March resulting from the FOMC making the second of three hawkish communication errors during the rate hike cycle. It was clear to us in September ‘22 that when the Fed raised the policy rate above 3%, they had reached what the NY Fed calls r**, the financial stability rate. In essence when the Fed’s System Open Market Account (SOMA) remittances to the Treasury ended, both the Fed and banking system were losing money on the massive securities holdings they accumulated during ‘20 and ‘21. The struggles in the banking system were not an isolated event, while not systemic for the largest banks, the losses froze a large percent of assets leading to an outright credit contraction. The market’s reaction, bank stocks falling to a discount to book value, was a clear message the Fed failed to hear, and they hiked three more times.
In August, following the signing of the Fiscal Responsibility Act, an unexpected $500 billion in Treasury coupon supply triggered a sharp move higher in longer maturity nominal and real rates. In September, the Fed made their third hawkish communication mistake by threatening to maintain a policy rate above 5% for 15 months, and the UST selloff accelerated. Actions by the Fed and Treasury, as well as cooperative inflation and labor market data stopped the three-month UST bear steepening, dollar rally, and equity market correction, for now.
In the first of our three year-end notes, we will work through the policy, economic, earnings, and markets outlooks for 2024. In last year’s outlook we expected a favorable environment for equities and Treasuries early in the year and a more difficult second half. For 2024, we expect a difficult start for equities due to a deteriorating growth and earnings outlook, a period of consolidation through mid-year when the Fed begins reversing excessively restrictive policy, and a late rally that leads to decent returns. The correlation of equities and Treasuries is unlikely to be similar to 2023, early in the year weaker growth will lead to a rally in the front end of the Treasury curve, but supply will weigh on the back end throughout 2024. One important point, the loosening of financial conditions in November is not sufficient to move the policy setting from excessive to merely tight, 100bp of cuts in 2024 are the minimum requirement to disinvert the yield curve and loosen the bank credit channel sufficiently to facilitate supply of Treasuries, as well as a range of private sector debt maturities and financing needs.
Policy Outlook: Put, Pause, Pivot
Approaching the Fiscal Limit
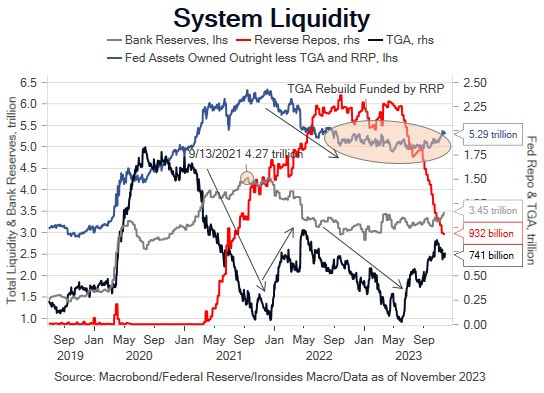
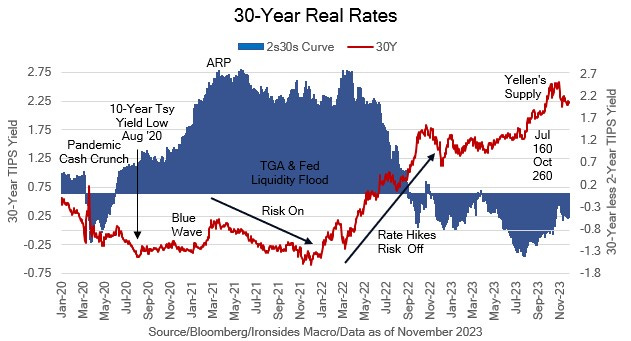
While ‘it’s never different this time’, it is rarely the same as the last time. The critical change between the ‘20s and the ‘10s, and the policy impact on financial markets, is the largest stock of government debt since WWII and aggressive debt management by the Yellen Treasury. In 2021, cash management by the Treasury turbocharged monetary liquidity injections and the performance of risky assets. In 2022, increased issuance began withdrawing liquidity before the Fed ended asset purchases and the liquidity injections associated with QE, thereby kicking off the 27% S&P 500 10-month correction. In 2023, the inability to issue debt through 1H23 due to the debt ceiling offset QT keeping liquidity abundant, which contributed to a strong first half for equities. During 3Q23 both the Treasury and the Fed were draining liquidity, and when the Treasury attempted to issue longer maturities and the Fed forecasted a 5+% policy rate through 1H24, a vicious Treasury market bear steepening that increased 30-year real rates 100bp and 10% equity market correction led by banks and small caps sent a message that the US was approaching its fiscal limit.
As the rate hike cycle winds down, the focus on balance sheet contraction and the interaction of QT with Treasury supply, as we discussed in our recent note, New Sheriff in Town, the Treasury Department, will intensify. There are three transmission channels for large scale asset purchases: liquidity, real rates and fixed income volatility. Given the size of debt and deficits, Treasury debt management will continue to have a larger impact than the Fed’s passive QT process on liquidity and real rates, while the supply of implied volatility is driven by the mortgage-backed securities market. The Treasury market rallied sharply following the October Treasury Quarterly Refunding Announcement that slowed the rate of longer maturity issuance, shifting towards the belly of the curve (2s-7s) and bills, aided by a shift in monetary policy away from additional hikes. In our analysis, a Fed pivot driven by lower employment will stabilize the Treasury market during 1H24, however, higher real rates and a continuation of rising term premiums are a secular trend.
Liquidity Outlook: Limited Options
The Treasury’s decision in October to increase bill issuance beyond the Treasury Borrowing Advisory Committee’s (TBAC) 15-20% guideline, combined with the Fed’s rate hike pause, explains the draining of reverse repo balances as government money funds swap into bills. Assets held in the Treasury General Account (TGA) and the Fed’s Reserve Repo Program (RRP) are ‘locked up’ in that they are outside of the banking system. If Treasury was issuing more coupon securities, they would be financed with bank deposits, reserves would be declining and there would be a reduction in the supply of private sector credit. The Fed views the level of reserves as abundant, estimates of the lowest comfortable level range from $2.5-$2.7 trillion, currently they are $3.45 trillion. Since the Silicon Valley Bank collapse, reserves increased $214 billion, despite deposit outflows of $145 billion and inflows to money market funds of $861 billion. The increase in reserves is likely integral to FOMC participants characterizing the banking system as safe and resilient, however, bank securities holdings have contracted by $439 billion, loan growth slowed sharply led by a modest contraction in commercial & industrial loans. We suspect the level of reserves is deceiving, which will become increasingly obvious as the RRP balance falls further. The Treasury has some flexibility with $750 billion in the TGA, and they could reduce issuance further but given the size of debt and deficits their degrees of freedom are limited. For the banks to stop reducing securities holdings likely requires a positively sloped yield curve, but not due to higher long rates. In other words, a good old-fashioned bull steepener due to Fed rate cuts.
Real Rates: A New Normal
There have been two Treasury supply driven high velocity increases in 30-year real rates, the part of the curve least impacted by the Fed’s balance sheet and interest rate policy. The first began when the GOP lost control of the Senate on January 4, 2021, leading to an additional $1.9 trillion stimulus bill that was passed using reconciliation and would never have occurred if the GOP maintained control. The second was during August 2023 when the Treasury announced $500 billion of coupon supply in 2H23 above consensus expectations. In each case 30-year real rates increased 60bp; in 2021 the increase stalled amidst Treasury reducing issuance and continued Fed asset purchases. In 2023, the increase was exacerbated by a hawkish Summary of Economic Projections (SEP) forecast for the policy rate until FOMC acknowledged the tightening of financial conditions in mid-October and took a November hike off the table. We characterized that shift as a policy pivot using 5% 10-year Treasuries and 2.5% for 10-year TIPS as the strike price.
Rate Policy: Necessary and Sufficient
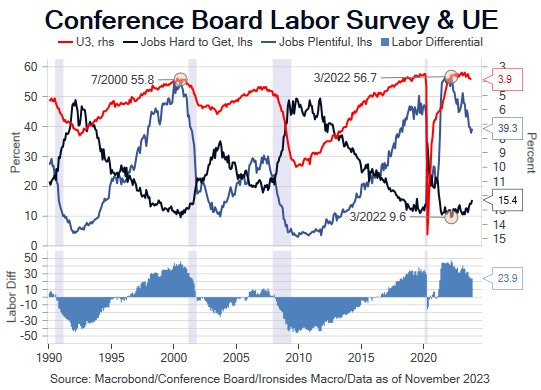
The October CPI, PPI, Import Prices and PCED reports turned the put into a pause, an outcome we expect to be confirmed at the December FOMC, assuming November CPI, due on the first day of the meeting, continues the core disinflationary trend. To turn the pause into a pivot and close the gap between the FOMC’s YE24 policy rate forecast of 5.1% and market expectations of a YE24 4.07% policy rate, in the words of Fed Governor Waller, "Something's Got to Give". Using the September SEP as a guide, their forecast of a 2.6% YE24 core PCED forecast is reasonable if not a bit low in our view. Their ‘24 GDP forecast of 1.5% is significantly lower than the last 5 quarterly readings of 2.7%, 2.6%, 2.2%, 2.1% and 4.9%, in other words, they expect slower growth. The forecast we take issue with is the unemployment rate; they reduced their YE24 consensus of 4.5% in June to 4.1% in September amidst an increase from 3.5% in July to 3.9% in October. The Conference Board’s labor differential indicator led the increase, has a good track record as a leading recession indicator, and is consistent with a 4.2% reading. The Fed’s forecasts and comments imply they view the increase in the unemployment rate as primarily attributable to increased supply, but in our view the increase in participation and immigration, and cooling of job switching, was more prevalent in 2H22 and 1H23. Negative revisions to net nonfarm payrolls in 9 of 10 months in 2023, lower labor income, hours worked, and wage growth are strong indications weaker demand for labor is the primary driver of a rising unemployment rate. Continued disinflation is the necessary condition for a Fed pivot, while slower growth, and more likely, higher unemployment, is the sufficient condition.
Inverted Curve: More Than an Indicator
Excessive monetary and Treasury cash management policy in 2021, followed by passive balance sheet and active rate policy tightening in 2022-23, caused the deepest yield curve inversion since the Volcker Fed and left the banking system saddled with massive losses on securities holdings. Throughout 2023, the debate on the yield curve as a recession indicator raged, but as you can see from the chart below, all curve inversions are not the same. The 1969, 2000, 2006 and 2019 inversions all preceded recessions, however, these shallow inversions were not reason enough for the banking system to restrict credit. The deep 1973, 1979-1981 and 2023 inversions created serious bank margin issues. The Volcker Fed started a chain of events that completely restructured the supply of mortgage credit that had been dominated by the thrifts (savings & loans). We doubt Chairman Volcker intended to cause a highly regulated mortgage market to be disintermediated primarily by securitization markets. We suspect the 2023 inversion, combined with technology and overzealous regulatory policy, will set off a similar chain of events that accelerates disintermediation of small banks.
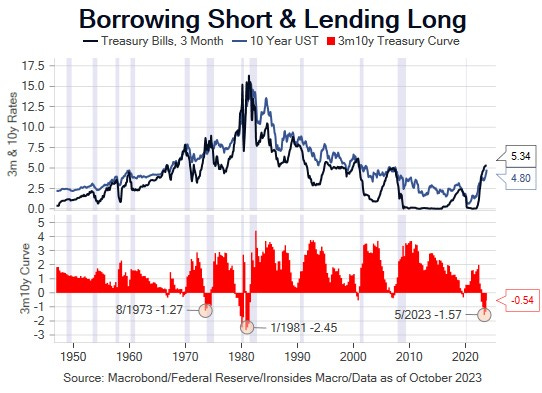
While the Treasury department’s options to facilitate yield curve disinversion are limited given the largest debt and non-recessionary deficits since WWII, they may attempt to add accommodation to the financial system by drawing down the Treasury General Account by reducing issuance in 1H24. The Fed’s degrees of freedom are significantly greater than the Treasury, given the increasingly discretionary approach to policy since the global financial crisis. A loose interpretation of their self-inflicted 2% inflation target, particularly if the demand for labor weakens further, are the necessary, and sufficient conditions for the FOMC pause to evolve into a pivot. In other words, monetary policy played a large role in impairing the basic banking model of borrowing short at rates lower than where they can lend long, and the Fed can create the conditions for banks to create credit to finance small businesses, real estate, particularly the large backlog of multi-family construction projects, and the Federal government, by disinverting the yield curve when they reverse the last 75bp of excessive tightening, plus a bit more. We expect this process to begin in March 2024, however, the timing will depend heavily on the monthly employment reports, and we are publishing this note prior to the November release.
Economic Outlook: A Double Dip Earnings Recession?
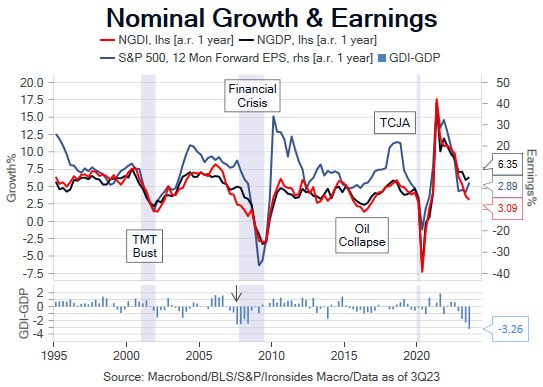
The incessant recession debate misses the point that the corporate sector already had a 3-quarter contraction in the private enterprise net operating surplus contribution to gross domestic income (GDI), an S&P 500 earnings recession that ended in 3Q23, and the BEA’s corporate profits measure that contracted 1.5% in 4Q22, 2.6% in 1Q23, increased 0.2% in 2Q23 and increased 3.3% in 3Q23. The timing of the end of the profits recession, approximately 6-months after the market bottomed in October ‘22, was in line with historical business cycle patterns. We prefer GDI to GDP to measure the business cycle, and while they should be equivalent over time, GDI has a better track record for capturing inflection points in real time (before revisions) and intuitively, income drives investment in capital and labor more than the sum total of production/output. That said, GDP is the output benchmark, and the National Bureau of Economic Research (NBER) is the standard for recession dating. With that in mind, the question for 2024 is whether there is a contraction in output and employment that the NBER defines as a recession deep enough to cause a double-dip earnings recession.
Synchronicity or Lack Thereof
There are several trends that are unique to the current business cycle. First, services contracted more than goods consumption during the deepest, briefest NBER recession on record. The magnitude of fiscal stimulus and direct transfers to households was also unprecedented. To benchmark consumption, we measure from mid-2014 when household deleveraging associated with the ‘08-’09 recession ended and trend consumption of 3% resumed for the balance of the business cycle. As of 3Q23, consumption is $178bn above trend, with services $234 billion above and goods $56 billion below. Although spending between goods and services were erratic in ‘23, it appears that the rebalancing/revenge travel process is winding down. More broadly, direct government transfers to households are decelerating and demand for labor is weakening, consequently, slower consumption is probable, though given strong household balance sheets, cash flow and relative insensitivity to higher rates, a sharp contraction is unlikely.
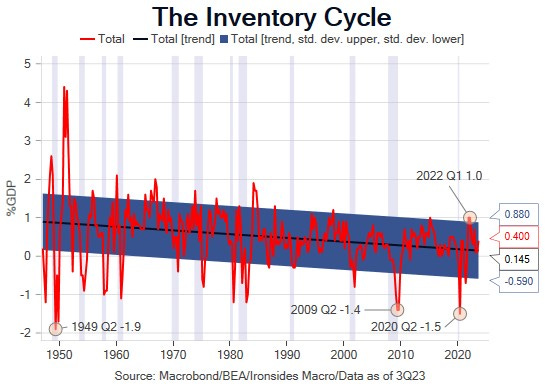
Pandemic related supply chain disruptions led to the most extreme inventory cycle since the post-WWII period. Supply chains cleared in early ‘22 leaving retailers with truckloads of goods in their parking lots and negative contributions to real GDP of 2.05% 2Q22 and 0.66% 3Q22. Both the aggregate numbers and retailer commentary imply inventories are clean and unlikely to exacerbate a softening in consumer demand. Just as the inventory liquidation process was winding down, residential investment collapsed due to the rate shock associated with the beginning of the most aggressive rate hike cycle since the early ‘80s. As a result, residential investment subtracted 1.41% from GDP in 3Q22 and 1.23% in 4Q22. Further downside is likely limited by strong demographic tailwinds, however, until and unless there is a reversal of at least 100bp of Fed rate hikes, a significant positive contribution from residential real estate investment is unlikely.

From 1Q22 through 2Q23 nonresidential fixed investment averaged a 0.76% contribution to GDP, however, in 3Q23 capital investment slowed and our leading indicator, regional Fed manufacturing survey 6-months forward capital spending plans is falling sharply. Like residential investment, there are secular tailwinds for capital investment that should limit downside, however, fiscal and monetary policy damaged business confidence. Consequently, capital investment is likely to turn negative in 2024 despite Biden Administration industrial policy. The best-case outcome is flat capex for 1H24.

One final source of expenditures before moving on is government spending. The quarterly annualized rates have been exceptionally robust; 3Q was 5.5%, 2Q 4.6%, 1Q 3.3%, 4Q22 4.8% and 3Q22 5.3% contributing 74bp per quarter on average to GDP. There is likely to be a change in contribution in ‘23, direct transfer payments to individuals are cooling modestly (though most of this is not discretionary), however, the administration has considerable discretion to disperse Congressional authorized funds from the industrial policy bills (renewable energy, semiconductors, infrastructure). Whether these outlays are productivity enhancing in the long run is a question that won’t be answered in 2024. We are skeptical, but in the near term, the CHIPS, Infrastructure and Inflation Reduction (renewables) Acts are likely to increase expenditures, employment, inflation.
Inventory investment contracted in mid ‘22, residential investment during 2H22, the ISM Manufacturing Index has been in a contraction for 13 months, and the new orders index that tends to lead the headline has been contracting for 15 months. While these sectors might cushion the effect of long and variable lags on consumption and investment, the best we can say about the GDP outlook for 2024 is that downside is limited by secular tailwinds. A shallow contraction for GDP seems unlikely to cause a double-dip earnings recession, however, there is certainly room for disappointment.
The Price Theory of Labor
“Demand for labor continued to ease, as most Districts reported flat to modest increases in overall employment.” November Beige Book
Wages peaked at the end of 2Q22, while the Bureau of Labor Statistics measures of net payroll growth and unemployment pointed to a ‘tight’ market, decelerating wage growth was the strongest signal that demand was weaker than these widely watched measures implied. Even today, as evidence mounts that demand has moved past balance to the verge of contraction, FOMC participants continue to describe the market as tight. As we noted earlier, the unemployment rate is close to triggering the Sahm Rule (3-month average 0.5% increase from the cycle low). Net revisions to nonfarm payrolls have been negative 9 of 10 months in 2023. Continuing claims are 16% above their early September level, at the highest reading since the last of the pandemic activity restrictions ended in the fall of 2021. Most notably, nominal labor income, hours worked multiplied by nonsupervisory average hourly earnings, cooled from 8.9% in January to 5.3% in October. These trends hint that small business employment is being overestimated and the labor market could continue to deteriorate throughout 2024. The labor market is the biggest economic risk, however, if it appears the Fed is missing their employment mandate, they will respond aggressively.
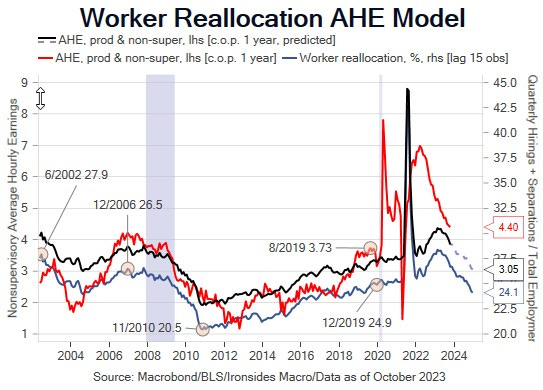
Since wage growth peaked in 1H22, a crucial difference between our view and the FOMC’s, as well as most street econ teams, is that diminished slack played a much smaller role in the wage price level shock. The Chicago Fed Research staff was on the right track when they characterized the pandemic effect on the labor market as the Great Reallocation, not the Great Resignation. Our work concludes that at least half of the wage spike was attributable to a spike in reallocation, the quarterly sum of hiring and separations expressed as a percent of the labor force, from June ‘21 through June ‘22. In effect, workers used the pandemic as an opportunity to change jobs within industries and move to different sectors. The Great Reallocation has evolved into a staycation as evidenced by worker reallocation 0.8% below the late 2019 level and a 2.3% quits rate, off from a 3% peak in April ‘22, and back to where it was in 2018-2019. Our worker reallocation model forecast is for nonsupervisory average hourly earnings to continue to slow to 3.05% a year from now.
Core Disinflation
We will review last year’s outlook note, 2023 Outlook: 9 to 4, but then what, when we write the third of our year-end notes, a year in review. Suffice it to say, the title is telling: we expected the primary macro theme through 1H23 to be disinflation. Given that CPI fell from 9% in June ‘22 to 3% in June ‘23, it fell further than we expected. The outlook through March ‘24 is almost as clear as last year’s outlook: CPI less shelter has been below 2% for 6 months, the lags built into rent of shelter and owner’s equivalent rent will put downward pressure on these annualized measures through at least March.
The outlook for core goods inflation is less favorable. CPI is benefiting from a second round of goods deflation with China a significant source as evidenced by import prices from China falling at a 2.8% rate in October. However, Asian exports are showing signs of stabilization and less tight monetary policy is likely to put an end to imported deflation as the dollar moves lower. In the longer run we do not expect a return to the globalization driven two decades of 0% core goods prices during the ‘00s and ‘10s, but instead see a trend closer to 2% as global supply chains are restructured. Finally, the fiscal impact on inflation from 6-7% deficits and spending running at a post-WWII high of 24-25% of GDP implies faster inflation for prices not set in global markets (services). Consequently, we expect inflation may overshoot our longer-run trend forecast of 3-3.5% in ‘24, but the disinflation process is unlikely to be the tailwind that it was in 1H23.

Productivity Boom or Policy Bust
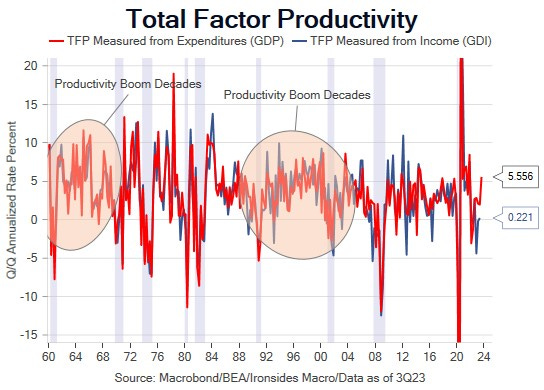
Early in the pandemic we became convinced that accelerated technology innovation adoption in consumer services, which we concluded was responsible for stronger labor productivity growth in the last two years of the ‘10s expansion, would accelerate further due to pandemic disruptions. Even with the last two quarters of robust labor productivity growth (3.6% quarterly annualized in 2Q and 4.7% in 3Q), there is little empirical evidence to support our thesis. First, total factor productivity (TFP, the technology input) measured from income is not surging like TFP derived from expenditures (GDP). Second, measures of productivity early in the business cycle are volatile due to output generally recovering prior to employment, then employment growth slowing as output settles into its mid cycle trend rate. That said, if we are correct that labor growth is overstated, and there is a worker reallocation productivity dividend due to workers settling into new, presumably more optimal jobs, the 2H23 trend could extend into ‘24 and beyond.
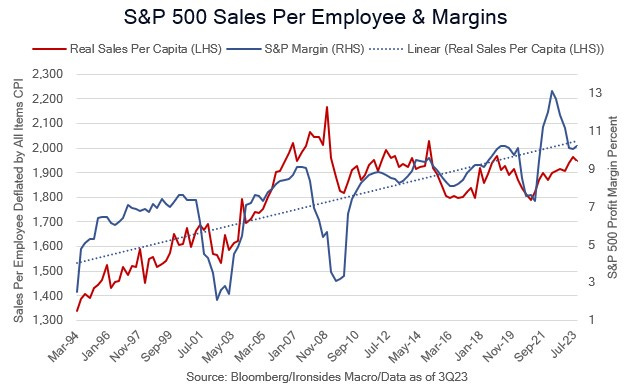
Artificial intelligence and the impact on productivity was a massively important theme for equity investors in 2023. The important question for ‘24 is whether the benefits are primarily accruing to the producers of the technology or diffusing across sectors and driving productivity and margins for consumer goods producers, services providers including healthcare and finance as well as manufacturers. We would expect accelerated technology innovation adoption to be evident in real sales per employee and profit margins. We may do a deeper dive on this topic in our macro themes outlook note. Needless to say, if our productivity boom thesis is correct, the outlook for the ‘20s is reasonably bright despite unsustainable debt and deficits.
Earnings Outlook
In our 2023 outlook we concluded that earnings risk was limited due to above trend nominal income and expenditures (GDI & GDP) and easing margin pressures attributable to a compression of the spread between prices paid and prices received. A look at Lipper Analytics revenue and earnings for 2022, 2023 and 2024 estimates are illustrative of the impact of strong nominal growth, the inflation price level shock and disinflation. In 2022 Lipper has S&P 500 revenue at 11.7% and earnings of 4.8% when nominal growth and inflation were at the post-pandemic peak. For 2023, assuming 4Q estimates, revenue is expected to be 2% and earnings 2.6% as nominal income growth slowed in large part due to disinflation. Lipper has 2024 bottoms up (analyst, not strategist, forecasts) revenues at 5.1% and earnings at 11.4%. If these numbers strike you as optimistic relative to our economic outlook, your conclusion is similar to ours. We have no issue with the improving margin outlook, and wage disinflation, clean inventories and stronger productivity should help. The risk is slowing nominal growth due to slowing consumption and investment that leads to slower than expected revenue growth and reduced operating leverage (revenues relative to fixed costs). If we get close to current estimates it is likely to be due to stronger numbers in the second half, however, expectations are for strong numbers in 1H24 even as net revisions turn down.

Net revisions, the number of analyst earnings estimate increases less decreases, led the rally from late October ‘22 through July ‘23, but are now falling for both the coming quarter and full year estimates. Consumer discretionary, typically the key sector leading out of recessions, led the recovery, however revisions for this key sector are now leading total revisions lower. A slightly different approach to analyzing the rate of change of estimates is to consider the change over the last 3 quarters to expected ‘24 earnings growth. S&P 500 ‘24 estimates held relatively steady, analysts expected a 12.5% increase on April 1, 11.7% on July 1, 12.1% on October 1 and 11.4% at the end of November (source: Lipper). Dispersion of the sector trends are more telling, consumer discretionary earnings growth expectations decelerated from 22% to 11%, financials cooled from 11% to 6%, tech and industrials held double digit increases (16% and 11%) and healthcare estimates accelerated from 10% to 20%. Discretionary and financials typically lead out of Fed policy normalization related corrections and recessions, as well as into recessions. Consequently, the deceleration in these sector estimates is another warning sign.
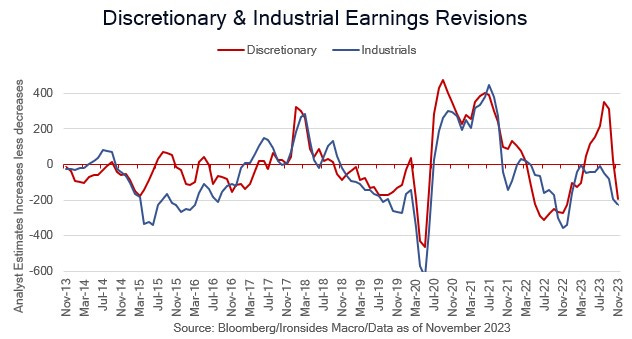
Disappointing results, rising unemployment, softer consumption and investment developing in 1Q24 are likely to trigger the FOMC to start reversing their last three excessive rate hikes, but the equity market is unlikely to look past weaker than expected earnings.
Back-end Loaded Equities, Front-end Loaded Bond Returns
Path Dependency
When we launched our Equity Portfolio Strategy research in October 2008 at Barclays Capital following the collapse of Lehman Brothers, we were the only top-ranked research house calling for a retest of the lows. The strategist narrative ran along the lines of the worst was over, stocks were cheap, policymakers would do whatever it took, and the recession would end in 2009. Perhaps due to our proximity to the eye of the storm, we were convinced the financial system losses had not been fully realized and the deleveraging process would be longer and more painful than our competitors (several remain prominent today) expected. While the situation is less acute today, and we may be biased by our personal experience, we remain convinced that the FOMC and Treasury’s actions that caused the second deepest curve inversion on record have not been fully realized. Our growth, earnings and financial conditions outlooks imply the first 10+% move of 2024 will be lower, as in 2009. The path matters, entry points even for patient investors are crucial, while exercises like year-end price targets are less important. That said, we are going to be a bit more specific this year and provide specific S&P 500 targets of 4100 in and around at the end of 1Q24, and a recovery by YE24 of 5100 with roughly a third of the rally from the lows following the November election. As one frequent CNBC guest says often, this is cutting the bologna pretty thin. That said our numerical targets, expressed in a narrative format, go as follows. We expect a deteriorating growth and earnings outlook that triggers rate cuts to cause a correction in 1Q24. During the 2nd and 3rd quarters we expect the equity market to stabilize and consolidate as the policy outlook improves but there is unlikely to be little evidence of fundamental stabilization. Somewhere around 2Q earnings season in July, a recovery rally will begin that builds momentum as the curve disinverts, supply is absorbed, the bank credit channel loosens, and the policy outlook improves. Elections breed optimism, and we expect the rally to extend into year-end as evidence of a productivity boom becomes increasingly evident.

Disinversion and a Secular Bond Bear Market
The above chart showing the earnings yield less the 10-year real rate (equity risk premium) and the benchmark rate are intended to illustrate a point we made through the ‘10s, namely the Fed’s rate suppression explained the elevated risk premium. In other words, it wasn’t that stocks were cheap relative to bonds, it was the bond market that was nearly as overvalued as was the case during the 1942-1951 Fed/Treasury Accord rate caps. With that in mind, the ERP is now at the low end of the pre-financial crisis period and 10-year real rates are close to the 2.1% median level from the end of the ‘01 recession through the mid ‘08. Given much higher levels of debt and deficits, and the outlook for demand for USTs from the Fed, banks and Asian central banks weaker than any point over the last 20 years, we suspect any drops below 2% for 10-year real rates attributable to either disinflation or weaker growth are unlikely to persist. Consequently, we look for the 2s10s and 3m10y curves to disinvert around mid-year, but 10-year nominals and TIPs are likely to end ‘24 above their current levels of 4.24% and 2.02%. Mortgage-backed securities have performed well during the recent UST rally, curve disinversion is likely to cause further spread tightening relative to Treasuries and investment grade credit.
Sectornomics
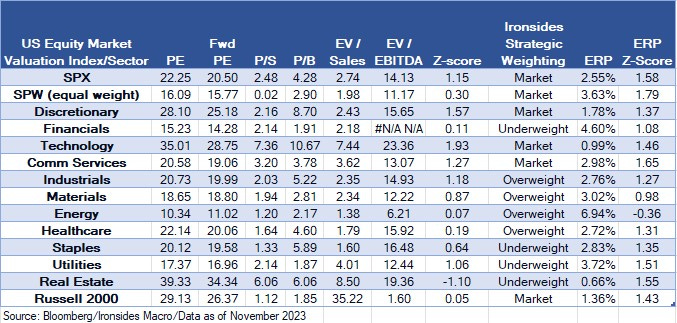
We’ve had a couple of forays into underweighting technology and related sectors since the pandemic, following nearly a decade of overweighting technology. While we are again contemplating a period where the benefits of technology innovation adoption, including generative AI, accrue to the users, rather than producers of the technology, our business cycle outlook argues against a significant shift from technology to cyclicals until the growth deterioration that triggers a Fed pivot unfolds. Periods of persistent small cap outperformance other than the immediate aftermath of a Fed policy driven correction or recession are rare. Consequently, until and unless a significant growth-related correction develops, we recommend a small cap underweight despite attractive valuation. Financials haven’t had an extended period of decent relative outperformance since the financial crisis underscoring the impact of regulatory policy on profitability. The sector faces two significant headwinds — the inverted curve and higher capital requirements, an issue that requires a change of control in DC to resolve. Industrials, materials and energy are our favorite cyclical sectors. Industrials are an intended beneficiary of industrials policy, strong relative performance and increased investment in materials and energy are unintended winners.
We will dig in on thematic investing in the second of our outlook notes, we hope you found this note helpful despite its length. Our intention is to help you work through the outlook for policy, growth, inflation, earnings, equities and fixed income. We have long viewed the process as at least as important as the conclusions.
Key Investable Themes & Asset Allocation:
Deglobalization & Capital Spending Boom: Industrials XLI -0.14%↓, SMH 0.25%↑
Technology Innovation Diffusion: Healthcare IYH 0.00, Industrials XLI -0.14%↓
Bear steepening or weaker growth bull steepening tactical trade: KRE 1.15%↑ and IWM 1.59%↑ put spreads. After closing these positions ahead of the November FOMC meeting, we suggest taking another look.
Global Equity Allocation: Overweight US and UK equities SPY -0.38%↓, EWU 0.00, underweight export dependent economies (China FXI -1.20%↓, Germany EWG -0.48%↓)
US Asset Allocation: Underweight equities SPY -0.38%↓, 10-year Treasuries below 4.5% are unattractive, 2s near 5% are attractive.
Barry C. Knapp
Managing Partner
Director of Research
Ironsides Macroeconomics LLC
908-821-7584
bcknapp@ironsidesmacro.com
https://www.linkedin.com/in/barry-c-knapp/
@barryknapp


