2023 Outlook: 9 to 4, but then what
Valuation compression is over, recession and earnings risk are lower than expected, but inflation will stall mid-year
The Mother of All Taper Tantrums
In our 2022 outlook, we forecasted a Fed policy normalization related correction in the first half of the year. The correction was larger than we expected and the terminal policy rate, while higher than we expected, is likely to be only marginally higher than the 4% level we thought the economy could absorb. We made a case for a more active balance sheet process, but because the Fed was unwilling to revise their approach, they hiked rates more than necessary and inverted the yield to levels last seen during the Volcker Fed. Consequently, elevated asset valuation and malinvestment took a hit in 2022, but those expecting continued compression of equity market multiples and real rates to levels prior to the QE era are likely to make investment mistakes in 2023. The Fed’s mandate is shifting from a singular focus on inflation to a more balanced approach, and so a pause in rate hikes is probable in 1Q23. The path from 9% to 4% inflation by mid-year is clear. The result will be markets partying like it’s 1995, but unlike ‘95, we do not expect the rally to last through the year as inflation stalls around 4% and rather than cutting rates, as the market expects and occurred in July and December ‘95, the FOMC is more likely to begin hiking again. We do not expect a recession, but if one develops nominal growth will keep expanding and earnings downside risk is similar to the 4% decline during the brief ‘80 recession. The largest risks are a resurgence of the energy crisis and the petrodollar effect on oil importing nations, malinvestment in areas like private equity real estate, the housing market and fiscally driven inflation leading to an overreaction from the Fed that impairs the supply side of the economy.
Passive Normalization & Asset Valuation
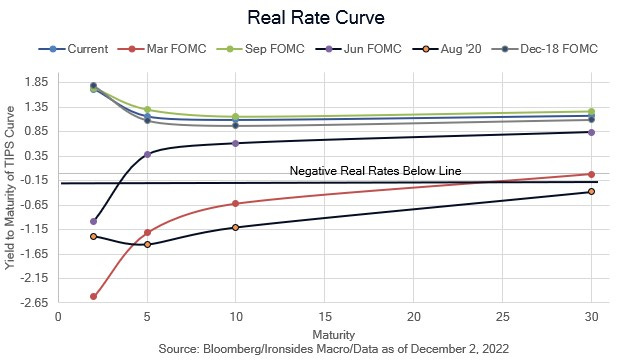
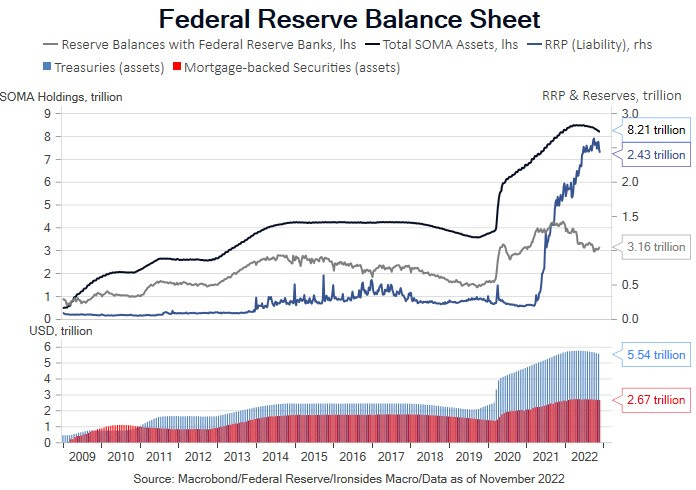
The dominant factor determining asset prices since the Global Financial Crisis has been unconventional monetary policy stimulus that culminated in the most important benchmark price in the global markets system, the 10-year US Treasury yield, adjusted for expected inflation, at -1.2% at the end of 2021. Underlying the ebbs and flows of fiscal and monetary policy injections, policymaker interventionism has expanded to levels last experienced in World War II. The Fed’s balance sheet expanded from 6% of GDP prior to the financial crisis to 34%, and federal government outlays from 20% to 25% of GDP. These two channels have different effects on asset prices and consumer price inflation. Large-scale asset purchases work through asset prices, while government spending has a more direct impact on economic activity and consumer price inflation. Housing is impacted by both: the Fed tends to focus on housing services and rents, however their excessive asset purchases in 2020 and 2021 created an asset bubble in house prices.
We have long maintained that Federal Reserve efforts to boost consumer price inflation through asset purchases created asset inflation and misallocated capital. News this week that Blackstone is limiting redemptions in their $70 billion real estate fund are a case in point. Investor purchases of distressed real estate stabilized the market in 2011, and in the back half of the ‘10s and during the pandemic, monetary policy can be directly traced to the flood into these PE real estate funds that crowded out first time homebuyers. One important note in analyzing market and economic risk: the debt residual from excessive fiscal and monetary stimulus is in the public, not private sector. Both eventually lead to deflationary busts; it just takes considerably longer when public sector debt breaches threshold sustainability levels. Consequently, for most investors time horizons the implications of unsustainable government debt and spending are inflationary, the antithesis of the aftermath of the financial crisis when the household and financial sectors held unsustainable levels of leverage.

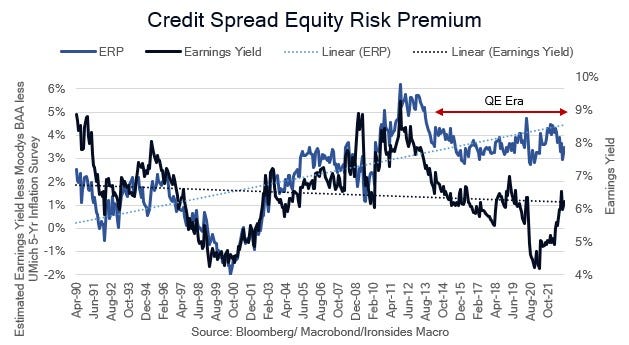
Even with the most aggressive rate hike cycle since the Volcker Fed, the impact of the Fed’s balance sheet and passive contraction process will keep the most important benchmark price in the global markets system elevated for years to come. A recent white paper from the research staff at the Kansas City Fed, summarizing peer reviewed, non-event studies (crisis effects) research, concluded that the impact of the Fed’s holdings of Treasuries and mortgages reduced the 10-year Treasury yield by 1.6%, or 4.5bp per $100 billion. Based on their (reasonable) estimates of a total reduction of $1 trillion in 10-year equivalents through 2025, the Fed’s passive balance sheet contraction process will only reverse 30bp of rate suppression. This is profoundly important and underappreciated in our view, as investors debate the outlook for earnings and valuation in 2023. The sharp increase in 10-year real rates (TIPS) in 2022 from -1.1% to +1.74%, prior to the recent pullback to 1.05%, can be directly traced to the S&P 500 forward earnings yield increasing from 4.4% at year-end 2021 to 6.25% in mid-October, a contraction from 23 to 16 in the price to earnings multiple. Despite the valuation shock as negative real rates normalized, assuming that equity market valuations will revert to levels prior to the QE rate suppression era, while the Fed’s balance sheet holds the benchmark rate at least 1% below the market level, is likely to led investors to incorrectly underweight risky assets.
Fighting the Fed
The pandemic struck amidst $60 billion per month of Treasury Bill purchases intended to increase bank reserves after the repo spike in September 2019 that was lifting the technology sector while cyclicals lagged, even as the US/China reached a detente in their trade war, foreshadowing pandemic patterns. The feeding frenzy in upside technology sector call options in the summer of ‘21 will live in infamy. Meme stocks, crypto tokens, technology companies with dubious business models and private investments attracted massive amounts of malinvestment during the excessive stimulus of ‘21. In our 2022 outlook, the primary theme we discussed was the negative implications for markets of the liquidity reversal from $1.7 trillion injected by the US Treasury and $1.5 billion of reserve creation resulting from Federal Reserve large-scale asset purchases in 2021. The 2021 liquidity injections boosted Treasury and equity valuations, particularly for long duration assets, to extreme levels. Before the Fed even began the rate hike cycle, the Treasury rebuilt their account at the Fed, draining $900 billion over the first four months of 2022. The liquidity factor will be roughly neutral during 1H23, as $60 billion per month of Treasury balance sheet contraction is likely to be offset by a draining of the Treasury General Account at the Fed due to issuance being constrained by the GOP’s use of the debt ceiling as a bargaining chip to slow spending growth. In other words, the debt ceiling will reduce Treasury issuance, thereby injecting liquidity that will offset the Fed’s passive runoff of maturing Treasuries. We checked street mortgage strategy estimates for agency MBS 2023 net issuance and prepayments of the Fed’s balance sheet, and the dispersion was fairly tight, particularly for issuance; across 4 dealers the average was $300 billion of net supply and $250 billion of Fed runoff. One potential wildcard is a change in the average duration of Treasury issuance, as there is a reasonable probability that they issue more longer-term securities. They would be wise to do so, it would facilitate some degree of disinversion that would help small banks and nonbanks create credit. These technical supply factors imply a cap on backend Treasury yields and disinversion/steepening of the Treasury curve.
The Path from 9 to 4
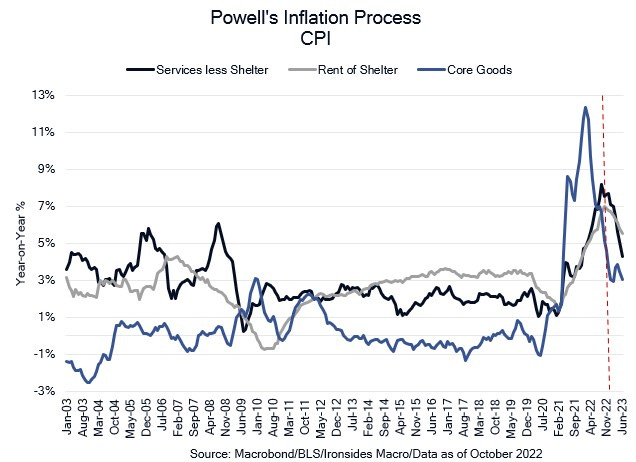
“To assess what it will take to get inflation down, it is useful to break core inflation into three component categories: core goods inflation, housing services inflation, and inflation in core services other than housing.” Federal Reserve Chairman Powell
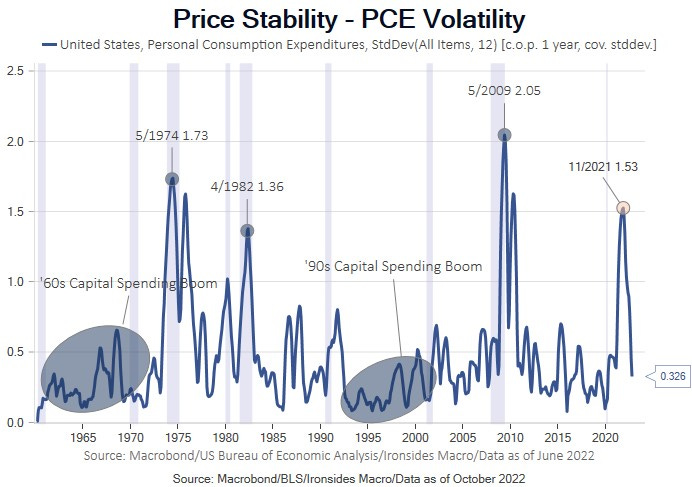
The Fed spent the 2010’s attempting to boost core inflation during the third most stable business cycle in terms of price stability. There were two factors that acted as major headwinds to their misguided mission to increase inflation: First, core goods disinflation largely attributable to the largest supply shock since Spain began trading silver for silk and stuff with the Chinese in the 1565, and second, financial sector regulatory policy that trapped the reserves created by large scale asset purchases in the banking system. We agree with the thesis that monetary stimulus impacts asset prices, and fiscal stimulus consumer price inflation, though we are not as dogmatic as some, particularly given the crossover impact on housing. A narrative analysis of the Great Inflation, Inflation as a Fiscal Limit, reaches a similar conclusion as our work on the ‘60s a year earlier than Bianchi’s paper was published did, the primary cause of the Great Inflation was fiscal, not monetary policy. With that in mind, federal government spending at 25% of GDP is unsustainable due to an empirical observation known as Hauser’s Law. Hauser’s observation that government receipts average 17-18% of GDP regardless of tax policy, only twice did receipts approach 20%, during the 2000 and 2021 stock market booms due to capital gains receipts. While the GOP will fight hard to stabilize spending growth, the 6% deficit will create an inflationary impulse until the gap is closed to a level closer to the Fed’s inflation target.
Early in the pandemic we concluded that it was an inflationary shock due to the impact on vulnerable supply chains and the massive policy response. We never considered the effect to be transitory, as we concluded in the early ‘10s that deglobalization was inevitable due to economic and political forces. We did not have 9% headline CPI penciled in for last year, but just as the pandemic was unforecastable, the Russian Invasion and associated food and energy shock wasn’t on investors’ radar a year ago. That said, the price shocks are receding, and the annualized inflation rates are lapping the worst of the price spikes. Using Chairman Powell’s approach, core goods, rent of shelter and non-housing core services, assuming 4% trend for the first two and 4.5% for the third, they will decline to 3%, 5.5% and 4.3% by June as they lap the hot inflation of 4Q21, 1Q22 and 2Q22. Our underlying trend assumptions in this illustration are conservative, they are 4, 2 and 1 standard deviations above their respective median levels this century, pre-pandemic. Until and unless fiscal policy is sustainable the Fed’s 2% target is unattainable. Consequently, the path from 9% to 4% is clear, however we expect inflation to stall around 4%, perhaps somewhat below, around mid-year 2023. Softening in the labor market and the glide path to 4% is likely to create an environment like 1H95 when growth was slowing but the equity market rallied 22% following the 75bp hike in November ‘94. It will not be easy for the Fed to restart the tightening cycle due in part to political pressures inside and outside of the system. That said, we expect a couple of ‘00s and ‘10s style 25bp hikes in 2H23. At that point the party like it is 1995 analog is likely to fall apart.
Idle Hands
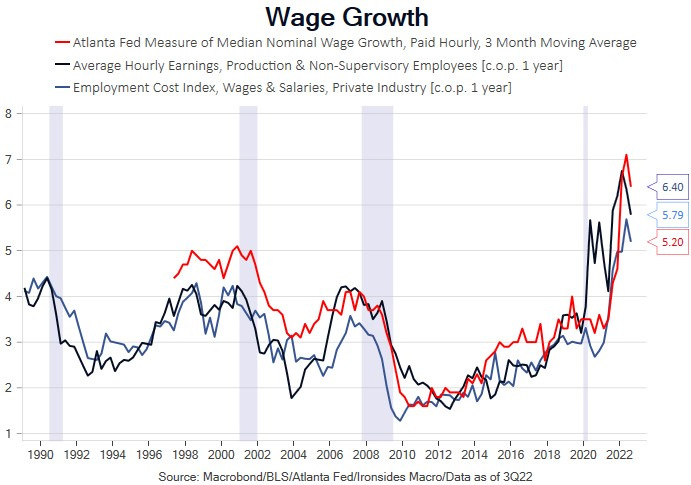
There is a preponderance of evidence that demand for labor is slowing everywhere except the most widely watched measure, the BLS establishment survey. The divergence between their household survey, -466,000 jobs in October and November, is 1.01 million jobs. We strongly suspect that the next benchmark revision will reduce the establishment jobs significantly. The financial crisis distorted seasonal adjustment factors for years, 3Q job growth would slow only to accelerate in 4Q. It seems likely that the pandemic caused even larger seasonal adjustment factor problems, and there was already a significant change in 2021. The more curious question is on the supply side: in November prime age and 55+ participation slipped while the 16–24-year-old category recovered. All three cohorts are below pre-pandemic levels, and in Chairman Powell’s speech this week he asserted that there were 2 million early retirements and 1.5 million fewer prime age workers relative to pre-pandemic trend due to reduced immigration and the pandemic. The employment ratio for the 16-24 cohort with college enrollment down hints that expanded government benefits is also a significant factor. The ultimate arbiter is price, that is wage growth. It is slowing, though the Fed is not wrong when they assert the current level is not consistent with their 2% target. Unlike the FOMC, we do not believe their 2% target is either attainable or necessary to have price stability. CPI averaged 1.5% for most of the ‘60s and 3.5% in the ‘90s, in both cases the volatility of inflation was low and capital investment was strong. Wage growth is the most important variable in the Fed’s reaction function in coming months, supply is constrained but despite the November report, demand is also weakening.
Growth Slowing, But Will it be Slow
We have long preferred gross domestic income over the expenditure method of quantifying economic activity. As an investor, we care more about earnings than revenues, margins are crucial, so why would we care more about the government’s attempts to count the aggregate amount of goods and services than the income generated by economic activity? Still, GDP gets the headlines and those reports led to a ridiculous number of inane recession debates in 2022 that began with the net export channel subtracting 3.25% from GDP in 1Q22 due to a massive surge in imports. In 2Q, there was a 1.9% negative contribution from slowing inventory investment emanating from the largest inventory destocking and restocking cycle since the post-WWII period. We heard a lot of uninformed observers describe the economy as in ‘technical’ recession. Meanwhile, the path for nominal gross domestic income painted a much clearer picture as it slowed from 14.3% in 4Q21, to 9.2% in 1Q22, 8.2% in 2Q22 and 4.6% in 3Q22. This raises the question as to whether the path is towards another recession or is the deceleration primarily a post-pandemic rebalancing that will stall somewhere close to trend growth. Additionally, if a recession develops it matters a lot to earnings and margins whether nominal growth continues to expand, as was the case during the four recessions during the Great Inflation.
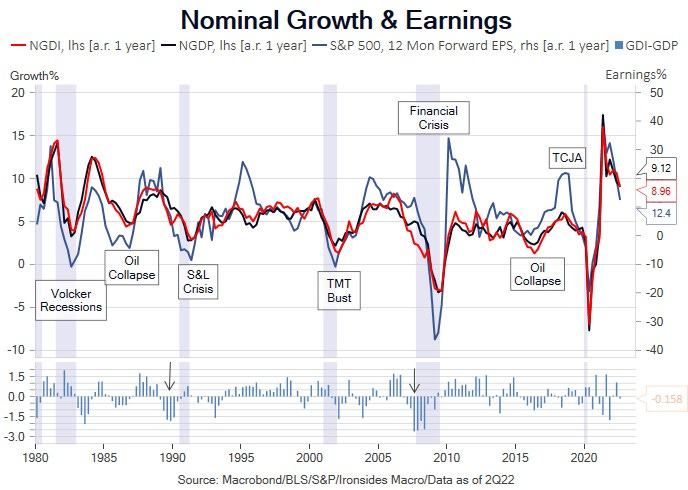
Our focus is markets, using policy and economics as inputs to identify under or overvalued assets. We could go deep into the economic outlook, but instead we are going to cover the primary drivers of growth and contractions then move on to market measures of recession risk. To begin with, for recessions during periods of high inflation in all cases but one, the monetary policy response played a crucial role. The first two during the Great Inflation followed a decade of very strong capital investment and contraction in fiscal policy. During all four, earnings declines were less than the post-war average due to nominal growth continuing to expand. During the Great Moderation, or disinflationary globalization era, bank financed credit bubbles burst, leading to greater than average earnings declines with bank earnings playing a large role in the contraction. We view the risk of a credit bubble developing as exceptionally low, debt levels for the household, nonfinancial corporate and financial sectors are low. There is excessive, unsustainable debt at the federal government level, however, at least in the early stages, governments begin by attempting to tax their way out of debt then move on to inflating away the debt. With the GOP controlling the House, that option is off the table. Debt service will soon be the largest item in the federal budget, the Fed’s portfolio is negative cash flow generating and their portfolio has large unrealized losses. If we have a recession, it is far more likely that nominal growth will continue to expand — were NGDP/GDI to contract the Fed would reverse much of the 2022 rate hikes. One note on debt and excessive credit: we do view private equity as an area of malinvestment, particularly PE real estate investment. Without generally low leverage and little banking system risk it is more likely to be a drag on investment returns and negative productivity factor than a systemic risk. Blackstone’s $70 billion real estate fund halted redemptions; this is a notable development.

Any growth debate in the US begins with the consumer, largely because the policymaker intelligentsia is dominated by new-Keynesians focused primarily on demand. There is palpable concern about the drop in the savings rate to 2.3%, but we are less concerned. For one, the savings rate from the income and spending report is calculated as a flow variable when it really is more of a stock variable. The stock of savings is still quite high, debt is low and debt service is not far from all-time lows. Rates have increased; however, the stock of mortgage debt is almost exclusively fixed rate. Finally, it appears to us that consumption is running above trend due to government transfers, so that even if the GOP is successful in slowing the rate of spending growth, transfers will remain above the ‘10s trend. We doubt there will be a sharp contraction in consumption in 2023.
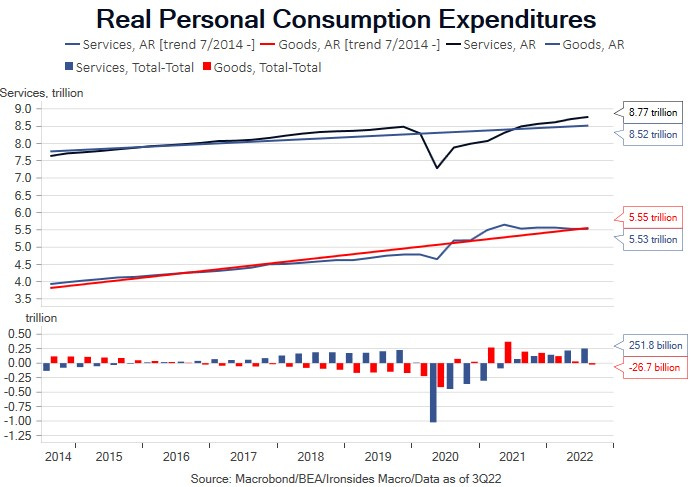
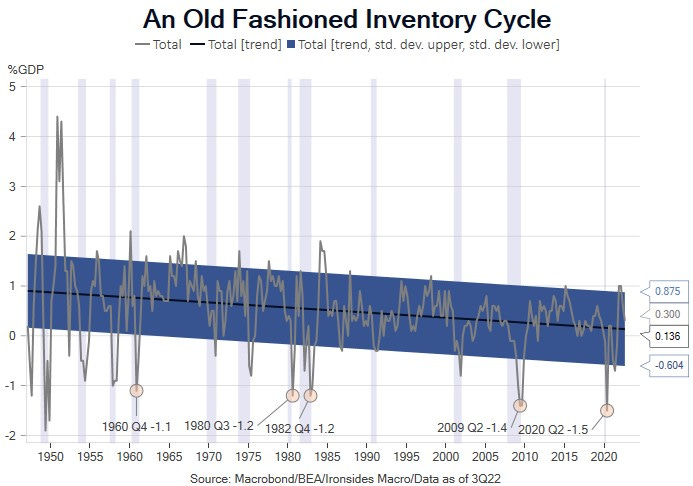
The pandemic caused the largest contraction in the inventory to GDP ratio since the post-WWII period even as GDP had its largest ever contraction. That led to a boom/bust cycle that appears nearly complete given that goods spending is marginally below trend and the inventory/GDP ratio is close to trend. Housing is also in recession, residential investment negatively contributed 1.4% to GDP in 3Q22, a larger drop than any quarter during the global financial crisis. Like private sector debt, there was no boom in construction but there was in prices; a systemic bust is unlikely, particularly given the strong demographic tailwind of Millennial household formation and the amount of equity in household real estate. Finally, capital spending was exceptionally weak last cycle, and has been for physical plant and equipment for several decades. The secular and economic case to rebuild our capital stock to derisk supply chains is compelling. Consequently, if consumption and nonresidential investment holds up, with the worst of the residential investment and inventory contraction complete, and the government outlays exceeding receipts by 6% of GDP, a recession of any consequence is a low probability outcome.
It’s Never Different This Time
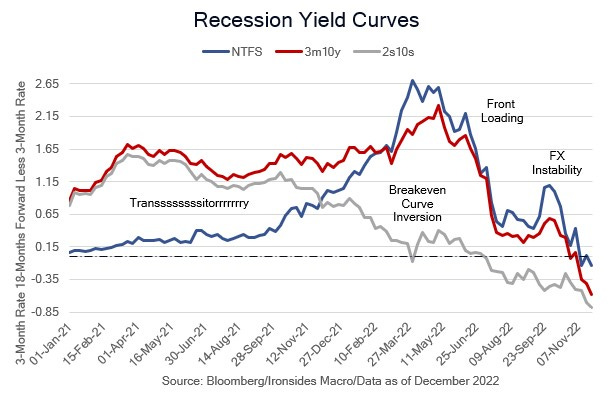
Treasury curves anchored to the belly of curve have been misleading indicators since the ‘00s when price insensitive buyers, initially Asian central banks preventing currency appreciation from eroding their mercantilist economic models, and later developed world central banks with large stocks of government debt faced with deflation risk, suppressed rates in the belly of the Treasury curve. Earlier in the note we worked through the Fed’s role in rate suppression. Therefore, while we view the deep inversion of the 2s10s or 3m10y Treasury curves as overstating recession risk, the smaller inversion of the 5s30s curve where the suppressed 5-year rate is higher than the less impacted 30-year bond and marginal inversion of the near-term forward spread (3-month rate, 18-months forward less the 3-month bill rate) is a more meaningful signal. We think the Fed has gotten the message on this and it is integral to the FOMC’s decision to slow the pace of hikes. Given that the sector of the economy most sensitive to an inverted curve is the Federal government and the Fed itself, this is less of a risk to the private sector than was the case in 2005. In other words, the impact on discretionary spending of tighter monetary policy, will create constraints on policy similar to the Great Inflation. As former Fed Chairman Bill Martin said, “the Fed is independent within, not of, the government”.
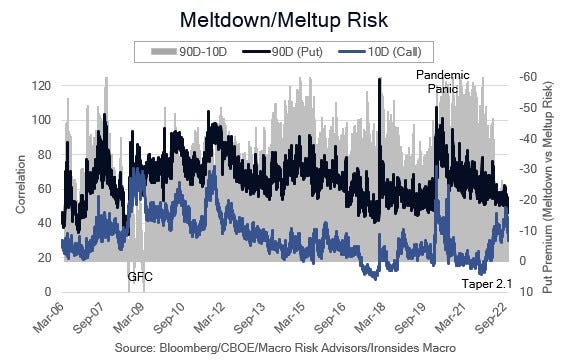
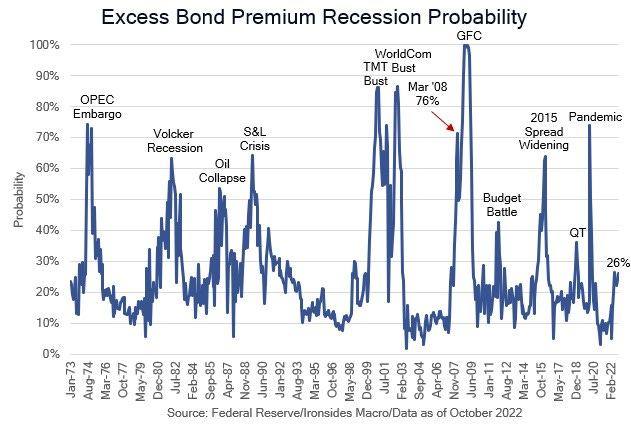
Credit spreads are better at forecasting recessions and equity markets at discounting recoveries. Given that spreads are tightening, and equities are rallying as the Fed approaches a pause in the rate hike cycle, the signal from assets that are not under direct influence of the Fed is that recession risk is fading. The Fed is still capable of causing a recession but the key pivot in the Chairman’s inflation analysis is to focus on wage growth as the critical inflation input for non-housing service inflation. This implies a more balanced mandate, rather than the singular focus on inflation. This remains an entity, like the evolution during the Kennedy Administration, biased towards inclusive employment. The new Chicago Fed President was part of the Obama Administration. We strongly suspect that tolerance for a significant increase in unemployment is limited.
Earnings and Margins
The outlook for earnings and margins is one of the most hotly debated questions in the strategist and economist community. We have been, and continue to be, more optimistic than consensus due to stronger nominal growth and operating leverage. When input prices spiked, and output prices lagged in late ‘21, as illustrated by regional Fed manufacturing prices paid and received surveys, we viewed this as a typical pattern early in the business cycle when operating leverage expands rapidly. In other words, sales growth relative to fixed costs more than offset marginal cost issues. Margins did contract in 2022, however they are 110bp above the ‘10s cycle peak. The largest contributor to the pullback is the financial sector, that has more to do with changes in accounting standards for loan loss reserves enacted prior to the pandemic. There has been a significant asset mix shift from cash and securities to private sector loans in 2022, those loans need to be reserved for over the life of the loan (the crux of the change in FASB standards), however the mix shift will improve profitability and increase net interest margins and profitability. Another sector where margins went through a wild ride back to where they began in 2019 was the consumer discretionary sector. With the inventory cycle and goods consumption back to trend, we look for stable margins in this sector. Tech and tech related margins remain well above prior cycle peak and could come under additional pressure. Materials, energy and industrial margins are likely to expand further. On balance we expect sales growth to slow with nominal gross domestic income from low double digits to high single digits, margins will contract, but remain above ‘19 peak due to operating leverage associated with strong sales growth. Margin contraction will be concentrated in the technology and related sectors as they continue to struggle with their pandemic hangover and slowing growth of cloud investment. On balance, our base case is mid-single digit earnings growth with considerable sector dispersion. If a recession does develop, earnings downside is limited to ~5%, an outcome that is adequately discounted by the 25% peak to trough drop in the S&P 500 and similarly sized valuation compression.

Markets Outlook
As inflation slides from 9 to 4 and the Fed pauses rate hikes, we expect a strong first half for equity markets. The S&P 500 is likely to exceed the late ‘21 high marginally before struggling in the second half as fiscally driven inflation and goods price inflation stabilizes above the ‘20s trend and the Fed restarts the hiking process, albeit with 25bp hikes. There are offsetting forces in the Treasury market; as detailed earlier the Fed’s balance sheet passive unwind and limited Treasury issuance (at least until a debt ceiling agreement) will make shorting Treasuries a difficult trade despite our relatively upbeat economic outlook. We do expect the curve to steepen when the timing of Fed pause becomes clearer. Prior to the curious November payroll report, we might have pounded the table on steepeners in this note. The dollar is likely to weaken against the euro, yen, pound and yuan during the Fed pause though we don’t see much upside for the export dependent nations due to shrinking current account surpluses as deglobalization takes hold. The same dynamic makes us cautious about overweighting international equities broadly, economies 2, 3 and 4 in GDP terms are all export dependent. We do not believe the energy crisis is complete, since the issues are structural due to misguided policy.
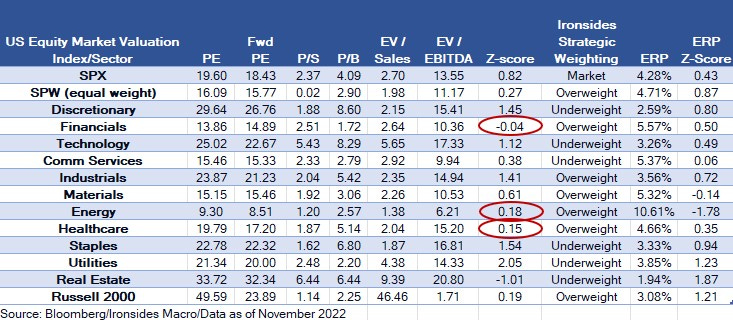
Within US equities, the technology and related sectors will benefit from stabilization in real rates as the Fed pauses. They were the worst performers in 2022, and they have lapped the strongest of their earnings comparisons. Despite these factors, these sectors remain rich and secular headwinds are building. We doubt they will outperform this business cycle, for absolute return investors, not those that are trying to beat a benchmark like the S&P 500, we suggest being underweight relative to their still large weightings in the S&P 500. When the rate hike cycle ended in early ‘95, financials were trading at similar discount of their relationship between price to book and return on equity. Financials rallied quite sharply in ‘95, we expect a strong performance despite continued regulatory headwinds. The industrial sector is the most effective way to play the deglobalization and technology innovation adoption trend. Materials and energy are likely to benefit from the revenge of the old economy, that is underinvestment in commodities. Healthcare is in an existential battle with government intervention, though we expect an acceleration in technology adoption, so we remain overweight. Defensive sectors were the best performers in 2022, they are rich and tend to struggle following monetary policy related equity market corrections.
Key Investable Themes & Asset Allocation:
Deglobalization & Strong Capital Spending Cycle: Industrials XLI -0.14%↓
Resilient Growth: Materials XLB 0.22%↑, Financials XLF -0.97%↓ IAT 0.00, Energy XLE -0.86%↓ XOP -0.67%↓, Small Caps IWM -0.40%↓
Technology Innovation Diffusion: Healthcare IYH 0.00, Industrials XLI -0.14%↓ and Financials XLF -0.97%↓
Global Equity Allocation: Overweight US and UK equities SPY -0.38%↓, EWU 0.00, underweight export dependent economies (China FXI -1.20%↓, Germany EWG -0.48%↓, Japan EWJ -0.34%↓)
US Asset Allocation: Overweight equities SPY -0.38%↓, underweight Treasuries TLT 1.16%↑, overweight credit LQD 0.09%↑
Passive QT and a rate hike pause: MORT 0.40%↑ and short interest rate volatility
Barry C. Knapp
Managing Partner
Director of Research
Ironsides Macroeconomics LLC
908-821-7584
bcknapp@ironsidesmacro.com
https://www.linkedin.com/in/barry-c-knapp/
@barryknapp


The liquidity factor will be roughly neutral during 1H22, as $60 billion per month of Treasury balance sheet contraction is likely to be offset by a draining of the Treasury General Account at the Fed due to issuance being constrained by the GOP’s use of the debt ceiling as a bargaining chip to slow spending growth.
Barry, do you mean to say “1H23” instead of “1H22”? See 👆