


Worshipping the False Fed Idol
Worshipping the False Fed Idol
The end of the productivity conundrum despite Fed policy uncertainty shocks

We will be transitioning the notes to a free summary and full note for paid subscribers format on June 1st after a three month free trial for our initial list drawn from our readers at Guggenheim, Barclays and Lehman. We realize some of you signed on later, we hope another month is sufficient for you to assess the value of our product. Our client chart book will became available to our paid subscribers this week, it will be updated monthly. There are 35 slides of our favorite charts, models and text. Please consider becoming a paid subscriber today for access. Additionally a short audio summary of our weekly gets sent to our paid clients. We expect to add additional products over time and as our long time readers know, we are always responsive to inquiries.
In this week’s note, we are going to explain our views on activist monetary policy and the implications for markets and the economy. Perhaps a good place to start is to consider that each business cycle since WWII has had a monetary policy normalization related equity market correction. This cycle has had eight of these episodes that have become known as risk-off events. This is not an accident, rather what F.E. Hayek called the ‘fatal conceit’. In essence monetary policy stimulus pulls forward economic activity and market returns, but does not boost the factor that determines per capita growth, productivity. We are not arguing that monetary stimulus is not effective in a crisis. As the new-Keynesians note because wages and some prices are ‘sticky’ at zero, when demand collapses significant damage to the supply side of the economy is possible. In other words rather than cutting wages during a recession, the workforce shrinks. Instead, in our view, the Fed’s definition of a crisis has evolved into a 10% drop in the S&P 500 and some fixed income spread widening, yield curve flattening, dollar strength or some form of asset price deflation. Said differently, QE1 was effective, the rest of the programs were counter-productive. Micromanagement of the business cycle impairs creative destruction and reduces business confidence due to the proliferation of monetary policy uncertainty shocks. Weak business confidence and below trend capital spending for most of the business cycle contributed to slow productivity growth; it is no accident that output per worker is accelerating after the end of unconventional monetary policy.
It’s Not Different This Time
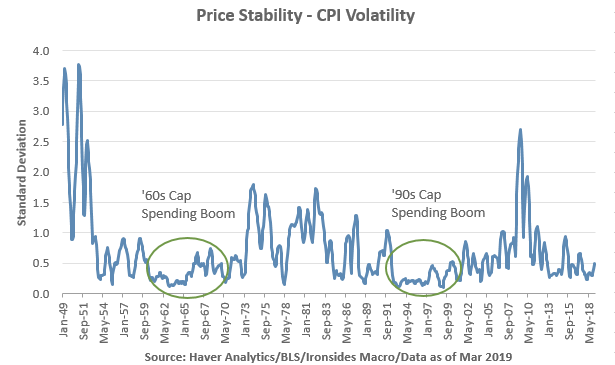
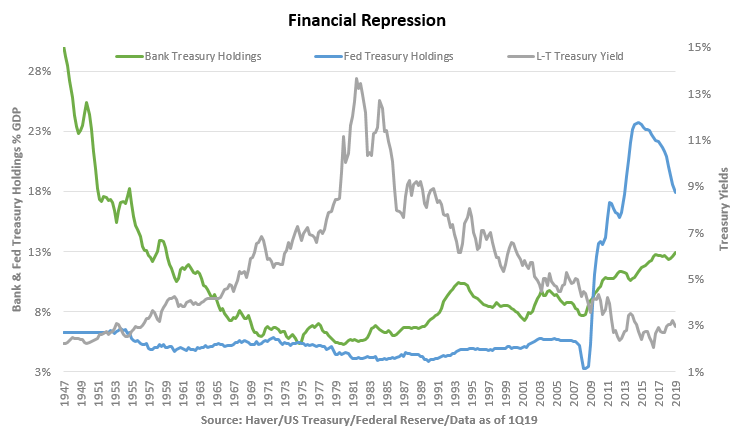
During World War II in 1942, the Fed and Treasury Department agreed to explicit interest rate caps of 3/8% on bills and 2 ½% on long-term securities as a means of financing war debt. In 1944, the allies met in Bretton Woods, New Hampshire and agreed to a fixed exchange rate regime intended to facilitate a recovery in global trade by avoiding the ‘Beggar Thy Neighbor’ competitive devaluations of the ‘20s and ‘30s. When the war ended government debt to GDP ratio was 120%, consequently the interest rate caps remained in place amidst a political fight over Fed independence. With both interest and exchange rates fixed, the only escape value for business cycle pressures was goods and services prices. CPI soared to nearly 20% in 1947 then fell to -3% during the 1949 recession. The annual standard deviation of CPI from the 3Q48 business cycle peak to the subsequent high water mark in 2Q53 was 2.2% more than double the 1% level during the Great Inflation of the ‘70s. The effects were profound; there were five recessions from the end of the war through the ‘50s, capital spending hit the lowest ratio to GDP in post-war history and had the single weakest cycle with a 0.6% annualized non-residential investment from 3Q57 to 1Q60. Through the decade, the Fed slowly gained independence, President Truman appointed William McChesney Martin expecting a political ally, only to have the Chair support the Fed/Treasury Accord that ended the Treasury rate caps. Seems Harry had been giving the Fed hell. By the end of the decade Treasury yields interest rates had risen to ~5% and inflation volatility fell to 0.5%. The stage was set for the ‘60s record duration expansion and 9% capital spending boom that accelerated following the JFK supply-side tax cuts.

This chart requires a bit of explanation, while investment has never been higher relative to GDP, the shift towards rapidly depreciating technology and equipment from physical plant means the outstanding stock is smaller. Still, the recent acceleration driven by IPP is apparent even on this long term chart.
We heard throughout the current cycle that large-scale asset purchases, forward guidance, maturity transformation – ‘Operation Twist’ – were unprecedented. This is of course not the case, explicit interest rate caps had a similar effect as asset purchases and forward guidance and there was a predecessor to Operation Twist early in the Kennedy Administration.
Communication Breakdown - It’s Always the Same
Let us consider the prior three recessions; the Fed drained reserves without any formal announcement in 1983. The ’94 rate hike cycle began with the first post-meeting statement and was exceptionally aggressive as they increased the real federal funds rate from 0% to 3% in a year including a 75 basis point hike in November on an inflation forecast. CPI headline and core were stable through the one year hiking cycle. Prior to the 2004-2006 ‘measured removal of policy accommodation, only Chairman Greenspan and Vice Chair Kohn discussed monetary policy. Despite these very different communication approaches and pace of normalization, the equity market reaction corrections were similar in magnitude and perhaps more interesting the 2004 and Taper Tantrum reactions in 10-Year Treasuries and implied volatility were nearly identical. Turns out there is no relationship between the magnitude of the risk-off event and pace of policy normalization underscoring why we refer to them as uncertainty or volatility shocks. None of these events marked the end of the equity market advance associated with the each economic expansion.

This cycle’s eight monetary policy normalization related risk off events were; the expiration of QE1 in mid-2010, QE2 in mid-2011, Operation Twist in 2012, the Taper Tantrum in 2013, QE3 in the fall of 2014, zero rate policy in early 2016 and the two 2018 shocks related to Fed balance sheet contraction and the ECB’s asset purchase program taper. In the early ‘10s after the debate over the cause of the ‘new normal’ intensified; in analyzing the portfolio balance channel – Fed purchases of low risk assets forcing investors to purchase riskier securities – we were startled to find that the equity risk premium for economically sensitive cyclical stocks increased sharply during the post-crisis QE period. From the launch of QE2 in the fall of 2010 through the Taper Tantrum in June 2013, the earnings yield for cyclical sectors less the real 10-year Treasury rate (TIPS) increased from 6% to 7.5%. In other words, equity market implied economic risk increased sharply despite stock prices increasing over this period. This was more than theoretical, in our role as Barclays Chief Equity Strategist we were recommending investors buy stocks with bond-like characteristics that were not benefiting from ERP compression, rather from a 200 basis point drop in the real 10-year rate. We found an interesting precedent; from October 2003 to March 2004, the Bank of Japan purchased $340 billion of US Treasuries with the proceeds of currency intervention. During a period when ISM went from the mid-40s to 60, 10-year Treasury yields fell from 4.4% to 3.6% and utilities were the best performing sector. We called it quasi-QE. Later in the 2013 KC Fed Jackson Hole Conference, academic support for large-scale asset purchases was crumbling while the risk premium of cyclical stocks was compressing sharply as the Fed progressed towards the end of QE. The primary lesson is that the portfolio balance channel does create an insatiable reach for yield, however, in addition to the misallocation of capital, the inevitable uncertainty shock when the policy ends impairs business confidence through a higher cost of capital for economically sensitive equities thereby reducing capital investment.

Therefore, when we think about the current monetary policy state of affairs, the most supportive aspect for markets and the economy is the pause. To be clear we are saying the best thing for the Fed to be doing more often than not, is nothing. Inflation volatility is low, inflation correlation is zero, capital investment in productivity enhancing technology is strong and labor productivity has improved significantly over the last 15 months. An ‘insurance cut’ and more QE would not be consistent with a belief in ‘free markets’, it would increase uncertainty and price volatility. Keep in mind the Fed still intends to change the mix of Treasuries and agency mortgage-backed securities in their QE portfolio and Chairman Powell announced that they are going to debate the duration of their Treasury holdings at the end of the year after balance sheet contraction ends. In other words, we may have another shock or two in the pipeline from their previous interventions into markets and prices.

We know you might be tired of this table, however, it is really useful for comparative analysis of business cycles
The Beginning of the End of the Productivity Conundrum
Because of our general distrust of the BEA’s seasonal adjustment process, we prefer the year-on-year measure for any series related to GDP, including productivity. Even with smoothing, nonfarm output per hour of 2.4% is above the post-war average of 2.1%. We remain optimistic for two reasons, first because manufacturing productivity has not recovered and our manufacturing renaissance thesis covered in last week’s note¹ implies it will. Secondly because software investment and innovation adoption in the service sector appears to be uneven and early stage. We thought the most encouraging part of Fed Chairman Powell’s press conference was his answer to the final question about improvements in the supply-side of the labor market and capital stock, and related recovery in productivity.
¹https://ironsidesmacro.substack.com/p/lets-make-a-trade-deal
Perhaps the most insightful work we read on productivity was “A Great Leap Forward, 1930s Depression and U.S. Economic Growth”, by Alexander J. Field. Field’s core thesis is that the Great Depression and later WWII masked, then delayed, the golden age of productivity that was to last until the ‘70s oil crisis. The technology innovation in the ‘20s took longer to be adopted than would have otherwise been the case. He goes on to note that the ‘90s technology investment boom initially only appeared to impact three sectors, finance, telecommunications and technology. It seems to us that Field’s analysis of productivity during the Depression is repeating when we travel through Newark Airport and eat a meal or buy a coffee using an iPad then later look at a Phillips Curve for the Leisure & Hospitality sector – raising wages and falling unemployment – and increasing profit margins for the restaurant industry group. It seems, as labor slack has diminished, the service sector has increasingly substituted capital for labor. Innovation adoption in the service sector we believe is a key reason why inflation correlation is zero.

Low correlation between the components of CPI implies that exogenous factors like differing rates of innovation adoption, global excess capacity in certain manufactured goods rather than labor slack or Fed credibility are influencing consumer prices. One year it is cellphone data wars, another portfolio management fees. Taken alone these items are transitory; however, they are both examples of technology innovation and disruption. Therefore, while we agree the Fed should not respond to inflation drifting below their 2% target, it is because doing so would increase inflation volatility and impair confidence. During the Fed’s review of their inflation target, we suggest they redefine price stability as either a range or better yet low volatility and correlation. With a board and staff full of New-Keynesian ‘sticky price’ economists, we doubt they will. Because of the lack of diversity of economic thought, we will keep our late 2019 rate hike forecast. Still, notwithstanding counter-productive interventionist monetary policy, at the core of why we remain optimistic about the duration of the business cycle and recommend being long US equities, is the recovery in productivity and positive impact on profit margins.
Barry C. Knapp
Managing Partner
Ironsides Macroeconomics LLC
908-821-7584
https://www.linkedin.com/in/barry-c-knapp/
@barryknapp
This institutional communication has been prepared by Ironsides Macroeconomics LLC (“Ironsides Macroeconomics”) for your informational purposes only. This material is for illustration and discussion purposes only and are not intended to be, nor should they be construed as financial, legal, tax or investment advice and do not constitute an opinion or recommendation by Ironsides Macroeconomics. You should consult appropriate advisors concerning such matters. This material presents information through the date indicated, is only a guide to the author’s current expectations and is subject to revision by the author, though the author is under no obligation to do so. This material may contain commentary on: broad-based indices; economic, political, or market conditions; particular types of securities; and/or technical analysis concerning the demand and supply for a sector, index or industry based on trading volume and price. The views expressed herein are solely those of the author. This material should not be construed as a recommendation, or advice or an offer or solicitation with respect to the purchase or sale of any investment. The information in this report is not intended to provide a basis on which you could make an investment decision on any particular security or its issuer. This material is for sophisticated investors only. This document is intended for the recipient only and is not for distribution to anyone else or to the general public.
Certain information has been provided by and/or is based on third party sources and, although such information is believed to be reliable, no representation is made is made with respect to the accuracy, completeness or timeliness of such information. This information may be subject to change without notice. Ironsides Macroeconomics undertakes no obligation to maintain or update this material based on subsequent information and events or to provide you with any additional or supplemental information or any update to or correction of the information contained herein. Ironsides Macroeconomics, its officers, employees, affiliates and partners shall not be liable to any person in any way whatsoever for any losses, costs, or claims for your reliance on this material. Nothing herein is, or shall be relied on as, a promise or representation as to future performance. PAST PERFORMANCE IS NOT INDICATIVE OF FUTURE RESULTS.
Opinions expressed in this material may differ or be contrary to opinions expressed, or actions taken, by Ironsides Macroeconomics or its affiliates, or their respective officers, directors, or employees. In addition, any opinions and assumptions expressed herein are made as of the date of this communication and are subject to change and/or withdrawal without notice. Ironsides Macroeconomics or its affiliates may have positions in financial instruments mentioned, may have acquired such positions at prices no longer available, and may have interests different from or adverse to your interests or inconsistent with the advice herein. Ironsides Macroeconomics or its affiliates may advise issuers of financial instruments mentioned. No liability is accepted by Ironsides Macroeconomics, its officers, employees, affiliates or partners for any losses that may arise from any use of the information contained herein.
Any financial instruments mentioned herein are speculative in nature and may involve risk to principal and interest. Any prices or levels shown are either historical or purely indicative. This material does not take into account the particular investment objectives or financial circumstances, objectives or needs of any specific investor, and are not intended as recommendations of particular securities, investment products, or other financial products or strategies to particular clients. Securities, investment products, other financial products or strategies discussed herein may not be suitable for all investors. The recipient of this report must make its own independent decisions regarding any securities, investment products or other financial products mentioned herein.
The material should not be provided to any person in a jurisdiction where its provision or use would be contrary to local laws, rules or regulations. This material is not to be reproduced or redistributed to any other person or published in whole or in part for any purpose absent the written consent of Ironsides Macroeconomics.
© 2019 Ironsides Macroeconomics LLC.