

The Fed's Trilemma
Disinflation, Fed's Trilemma, S&L Crisis, Rate & Curve Suppression, Bad Breadth

There is a lot here this week, disinflation progress and the longer run outlook. The Fed’s trilemma in a 3% trend inflation regime, lessons from the S&L Crisis, the outlook for Treasuries, the yield curve and equities, as well as an update on the debt ceiling and budget negotiations.
Gimme Shelter
The disinflationary trend was further solidified by this week’s April CPI and PPI reports. The first stage of the move from 9% to 3-4% was driven by core goods prices as they declined from their February ‘22 peak of 12.4% to 1% in February ‘23. In April, core goods increased 0.57%, boosting the annualized rate to 2.1%, with near term momentum in PPI easing further, we do not expect additional strength. In the longer term, zero goods inflation, which persisted in the ‘00s and ‘10s due to the emergence of China as the world’s factory, is over. Stage two is easing of core services less rent of shelter; the peak of this key measure for Fed Chairman Powell was September when the 3-month annualized rate was 11.6%, the 6-month annualized rate was 9.5%. In April the 3-month annualized rate was 3.6%, 6-month was 3.7% and the 12-month was 4.5%, down from its peak of 6.6% in December ‘22. Since the peak in September the average monthly change is .27% with no significant outliers. Between now and September the average monthly comp is 0.49%, in other words the annualized rate is likely to put additional downward pressure on all items CPI and converge with the 3 and 6-month rates.
This brings us to lag impaired rent of shelter that has just begun the third, and final stage, of the disinflation trend. After 7 months of monthly changes averaging 0.73%, subject to a range of less than 0.1%, March cooled to 0.59% and April to 0.45%. The annualized pace peaked at 8.99% in March, 16 months after the peak of the Apartment List Rents Index, and 11 months after the peak of the Case Shiller 20-City Composite House Price Index, April eased to 8.69% and the May reading cooled further to 8.13%. If we remove shelter from all items CPI to get a cleaner read on the underlying trend given the lag of this measure capturing new rents, CPI less rent of shelter peaked at 7% in June ‘22, both April and May were 2.2%. While it takes a bit of digging to detect the underlying trend, as we did here, when we lap the white hot all items CPI monthly changes of 0.9% in May ‘22 and 1.2% in June ‘22, likely pushing the headline down to ~3.4%, the public’s anxiety will ease, which will reduce political pressure on the FOMC.
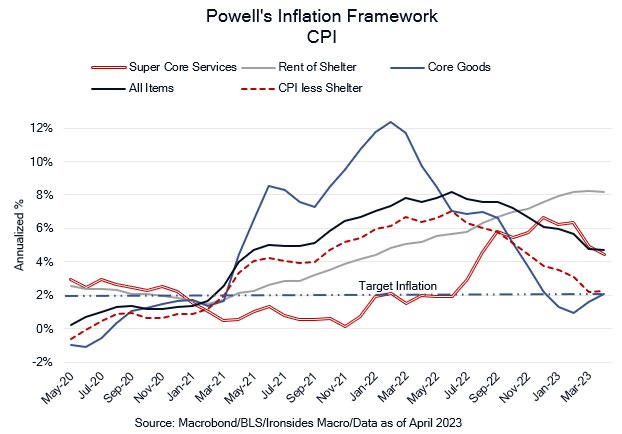
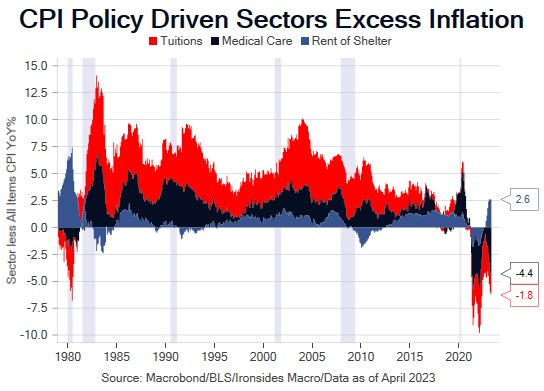
As the path from 9% to 3.4% that we detailed in our 2023 outlook reaches its conclusion, we expect higher trend inflation to become increasingly evident. The median for all items CPI during the Chinese Labor Shock era from 2002 through the pandemic was 2.1%. The composition using Chairman Powell’s inflation framework was -0.05% for core goods prices, 2.4% for services less rent of shelter and 2.87% for shelter. The shelter measure is particularly relevant, it is the most direct channel for monetary policy and the above Fed inflation target trend in shelter from 2002-2020 includes a four-year boom from 2002-2006 and the largest bust since the Great Depression. In other words, the Fed’s efforts to boost inflation that was only marginally below a target they adopted in the midst of an exogenous goods price shock, led to a faster than target increase in housing costs. While this unintended consequence is problematic, the pandemic policy response that led to a 45% increase in the Case Shiller 20-City House Price Index in 16 months, is likely unreversible absent a deep recession. There is little doubt monetary policy was a major contributing factor to the home price spike, the correlation of price changes of the 20-cities, despite very divergent pandemic restrictions, was .97 through the first 10 months of 2021, a level far above the ‘02-’06 bubble or the crash that followed. The spread of mortgages to Treasuries and mortgage rates went to all-time lows and left the banking system, and Fed’s balance sheet, saddled with mortgages that are eroding capital and reducing the supply of housing just as the largest age cohort reaches peak household formation.
Given the damage the pandemic policy response did to housing supply, it seems improbable that shelter inflation will cool to the pre-pandemic trend. Publicly traded apartment REITs have reported that blended rental increases (new rents and renewals) are running 4-5%. The developing credit crunch is likely to further impair supply, and we strongly suspect trend shelter inflation will run above the prior trend even with higher real interest rates. If trend goods inflation settles at 2% due to restructuring of global supply chains, shelter is 3.5% due to supply constraints and demographics, and core non-shelter services inflation averages 3% due to increased fiscal transfer payments and outlays at record levels of GDP, trend inflation will be 2.9%. This is a probably a best-case scenario; our base case is 2.5% goods inflation, 4% shelter and 3.5% core services, implying 3.4% trend inflation and the risks are skewed to the upside due to fiscal and monetary policy as well as the restructuring of global supply chains.
Degrees of Freedom - The Fed’s Trilemma
Donald Kohn Says BOE and Fed Suffering Keynesian ‘Group-Think’
(Bloomberg) -- Central banks need to break the stranglehold of Keynesian economics to end the group-think that may have been partially responsible for the delayed reaction to soaring inflation, said Donald Kohn, a former Federal Reserve and Bank of England policy maker.
Kohn said the BOE and Fed could benefit from greater intellectual diversity among policy makers. It’s crucial for those officials to come from “a variety of backgrounds, not just standard academic Keynesians,” he said Tuesday at a hearing of the House of Lords Economic Affairs committee in London.
Lords on the committee heard that the “new Keynesian dynamic stochastic equilibrium” model, which has no place for asset prices and money, is too dominant and that space needs to be made for economists with other backgrounds.
Note: The President nominated Adriana Kugler to the Board and Philip Jefferson to Vice Chair for monetary policy. Neither has any worked in the private sector nor has any capital markets experience.
As the Fed’s battle with pandemic policy driven inflation winds down, new battles with financial stability and employment are just beginning. If our expected path for inflation, the supply of bank credit and demand for labor are correct, the FOMC is likely to face a mandate trilemma due to pressure on all three mandates, exacerbated by the dubious decision to define stable prices with specificity that constrains policy flexibility. The standard Fed framing, and analysis from former Fed officials now employed as street economists, is a Phillips Curve model tradeoff between inflation and employment. Don Kohn has it right, the last three recessions prior to the pandemic were driven by asset bubbles that caused banking credit contractions not detectable by dynamic stochastic equilibrium models. The risk of another credit contraction is building.
Very few clients expect a return to 2% trend inflation, as we will explain later in the note, and breakeven inflation rates are ~80bp below where they would be in the absence of Fed holdings of nominal and inflation protected Treasuries. In other words, the collective wisdom of the market doesn’t expect the Fed to meet their mandate either. Additionally, as we detailed last week, we received little pushback on our view that the banking system equilibrium interest rate (r*) is well below the current policy rate. This raises the question about how much additional deposit flight and credit tightening is required for the Fed to reduce the policy rate to a more sustainable rate. Without a goal for the Federal Reserve to provide financial stability, there might not be a Federal Reserve. We’ve been arguing for months that demand for labor was weakening, and this morning, following a sharp increase in initial jobless claims, we heard David Rosenberg in a CNBC interview note that the unemployment rate is in the Conference Board’s lagging economic indicators and payroll growth is in coincident indicators. Our expectation is that by September the FOMC will be faced with a trilemma: inflation will have stabilized above their 2% target, bank deposits will be approaching double digit negative growth, credit will be contracting, and much weaker labor market demand will complete the trifecta of mandate misses. Although the FOMC’s singular focus has been inflation for the last year, we strongly suspect there is a very low tolerance for rising unemployment from the current committee. Hopefully the lag between credit contraction and weaker coincident and lagging employment data won’t be too long.
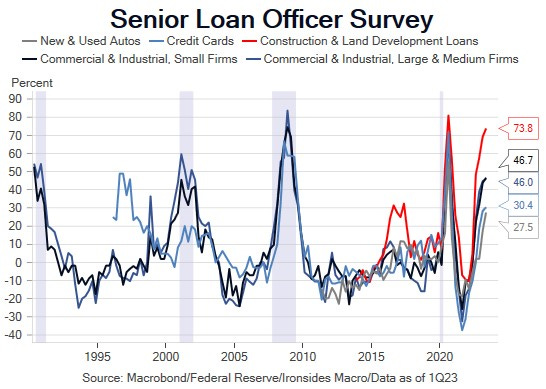
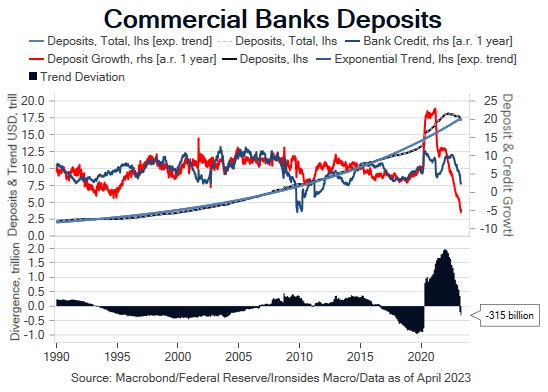
Responses to the 2Q23 Senior Loan Officer Survey were due on April 7, consequently, even with the modestly stale data, the benchmark tightening standards on commercial & industrial loans is approaching levels reached during the ‘91 S&L recession and ‘01 TMT investment boom collapse. Over the history of the Fed H.8 data series, the monthly annualized deposit growth rate for commercial bank deposits only went negative twice, -0.25% in February ‘93 and -0.5% in April ‘94. Similarly, bank credit only contracted twice, from August ‘09 through June ‘10, the trough was -4.25% and again from March through July ‘11 with a low of -1.2%. In the late ‘70s and in the early ‘00s, both deposit and credit growth exceeded 10%, where the first contributed to a consumer price inflation surge, the second led to asset price inflation. The 20% surge in deposit growth was double the prior record and while the aggregate supply of deposits offers comfort when considering the sensitivity of household spending, the flow of deposits out of the banking system could fall to -10%, and if credit falls by half that rate, the contraction will be as deep as the financial crisis. The economic impact is likely to be more muted given 15 years of household deleveraging, nevertheless, credit contractions are rare and painful.
In the week ended May 5 initial claims increased from 242,000 to 264,000. The next report is the same week of the payroll establishment survey, and if claims remain near the latest week’s level, they will be 18,000 above the March and April establishment survey weeks, 50,000 above the February and 60,000 above the January surveys. One week does not make a trend, consequently, we will be looking for confirmation in the survey week report, as well as in the continuing claims report.

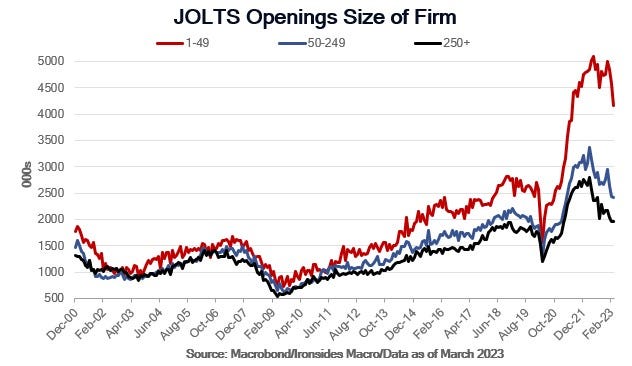
Thanks to Mike Green, Chief Strategist at Simplify Asset Management, for bringing to our attention that the 1.586 million year-to-date reduction in job openings has been primarily driven by small and medium businesses. Another notable, albeit anecdotal, data point this week was ZipRecruiter pulling its revenue guidance. In a shareholder letter the company wrote the following. “This reflects a contraction in demand, not only with SMBs, but also with enterprises, as both are continuing to reduce the number of jobs they post and the amount they spend on advertising.” Small business activity is hardest to measure, particularly in the era of low government survey response rates, and is the sector likely to be most impacted by a tightening of bank credit.
Note: Mike Green writes a weekly note on Substack, it is on our recommended list
Echoes of the S&L Crisis
We’ve heard a number of economists refer to the S&L Crisis as an analog for the travails of small and medium banks as a consequence of the pandemic inflation shock, excessive policy response and aggressive rate hikes. There were some interesting similarities; in 1980, when Fed Chairman Volcker was beginning his aggressive inflation policy in response to CPI reaching the highest level, at 14.8%, since the post-WWII 19.7% peak, there were 4000 thrifts (S&L’s) with $600 billion in assets. Due to regulatory restrictions, their assets were highly concentrated; $480 billion were mortgage loans, these loans were half of the $960 billion outstanding. In March 1980, when CPI peaked, the monthly average yield for 10-year Treasuries was 12.75%, and 3-month bills averaged 15.2%. Mortgage rates rose steadily, then quickly in the ‘70s from 7% in ‘71 to 10% in ‘74, before backing off to either side of 9% until breaching 10% in late ‘78 before surging to 16% in the spring of 1980. While thrift assets were way underwater on a mark to market basis, the industry was being disintermediated by the burgeoning money market mutual fund industry capitalizing on regulatory policy that prevented paying interest on checking accounts and capped rates banks and thrifts could pay on savings accounts. The rate caps on liabilities meant thrifts could not attract additional deposits to invest in mortgage loans at higher rates. This turned a large portion of the industry into zombies, the only solution was regulatory forbearance (extend & pretend) until rates fell and the yield curve disinverted.
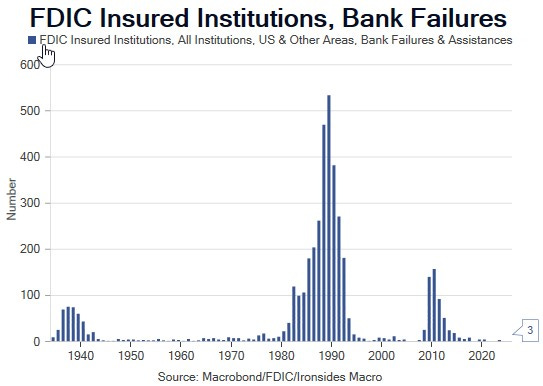
By September 1982 as the second Volcker recession was drawing to a close, the 3-month, 10-year Treasury curve had steepened from -245bp in January 1981, to 442bp, however with 10s at 12.34% and 3-month bills were 7.92%, the rate caps meant they still struggled to attract assets. The early ‘80s were a period of rapid regulatory reform, rate caps were lifted, deposit insurance increased from $40,000 to $100,000, loan to value caps were increased, restrictions on assets were loosened beyond mortgage loans, and thrift conversion from mutual to shareholder ownership all contributed to 56% asset growth from ‘82 to ‘85, far above commercial bank asset growth of 24%. The yield curve was steep through much of the ‘80s, generally in a range between 200bp and 300bp until the FOMC raised the policy rate to 9.75% causing the curve to flatten to a monthly average of 13bp in August ‘89. The Federal Savings and Loan Corporation (FSLIC) insurance fund became insolvent, Congressional action closed it, started the Resolution Trust Company that ended the extend and pretend government support process and accelerated the liquidation of 1043 of 3234 thrifts.
There are a number of lessons from the S&L Crisis. Disintermediation and financial sector innovation left this highly regulated sector in its wake. We omitted the development of the mortgage-backed securities market for brevity, however innovation on both the liability and asset side of thrifts balance sheets is similar to the impact of fintech and private credit today. The argument for regional banks today is based on efficient credit allocation, but the issue isn’t credit; like the first wave of failures in the early ‘80s, the problem is duration mismatch. One open question is whether small and medium banks can keep up with innovation. The other more complex question is whether the Fed’s excessively large balance sheet will continue to suppress rates and prevent a full normalization of the yield curve that will stabilize the basic business model of borrowing short and lending long.
Savings and Loan Crisis, Kenneth J. Robinson, Federal Reserve Bank of Dallas
Government Assistance and Moral Hazard: Evidence from the Savings and Loan Crisis
The Origins and Evolution of the Market for Mortgage-Backed Securities
Rate & Yield Curve Suppression
We received a number of questions during our meetings in NYC and Boston and early this week about our outlook for equities and rates. Let’s begin with Treasury market valuation and the paper from the KC Fed that concluded the Fed’s assets owned outright is suppressing the nominal 10-year Treasury yield by 160bp. This resonates for the following reasons.
First, 10-year inflation protected Treasuries are 1.23% and nominals are 3.43%. Prior to the QE era, from mid-’05 through mid-’06 as the Fed was raising the policy rate from 3.25% to 5.25%, the 10-year real rate (TIPS) rose from 1.64% to 2.53% and following the end of the Chinese currency hard peg in mid ‘05 and Japanese QT in early ‘06 when the ‘conundrum’ eased, nominal 10s increased to 5.13%.
Additionally, the Richmond Fed’s Lubik-Matthes Natural Rate Model increased to 1.91% in the latest reading (4Q22). Consequently, in the absence of the Fed holding ~1/3 of the nominal UST, TIPS and agency mortgage-backed securities market, 10-year real rates and inflation breakevens would each be ~80bp higher at 2% and 3% respectively. Market inflation expectations of 3% would be consistent with our forecast and feedback from clients as well as consumer inflation surveys. As we know, the Fed is unlikely to alter their passive QT process, and the KC Fed analysis concluded only 30bp of the 160bp rate suppression would be removed by the end of ‘25.
We worked through this valuation exercise to underscore the complexity of trades that should work, like yield curve steepeners with the rate hike cycle most likely over and the probabilities skewed toward rate cuts. For example, the 2s10s curve is -55bp, if the Fed delivers on our forecast for 50bp of cuts by year end, the conditions that would trigger those cuts will likely push 10-year yields lower. After the cuts the curve will steepen, but it would likely flatten as credit contracts and the labor market weakens. We like Dec ‘23/’24 steepeners because we think the banking system can limp along at a 4% policy rate and the household sector will be fine at that level of rates. In other words, we do not expect 200bp of cuts by the end of ‘24. That said, it might be too early for that trade as well. On balance, we don’t see any obvious tactical mispricing in the Treasury market, spreads on credit and mortgages are fair and rates volatility is historically rich but at the low end of the recent range.
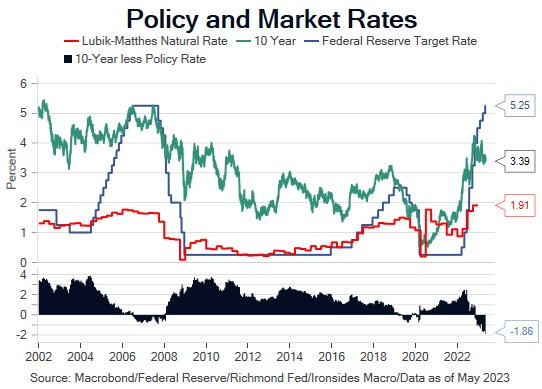
Lubik-Matthes Natural Rate of Interest
Bad Breadth
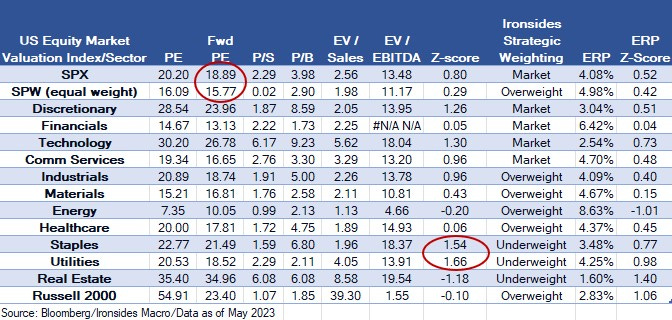
The equity market has been something of a torture chamber since the Silicon Valley Bank collapse and Fed’s ill-fated decision to hike an additional 50bp. At that point we altered our outlook from the ‘95 analog, reduced our financials weighting and expected a trading range until the Fed confirmed an end to the hiking cycle. A key element to our positive outlook for 1H23 was the debt ceiling’s counterintuitive impact on liquidity. With a deal likely within weeks, the liquidity dynamics are on the verge of significant tightening when increased Treasury issuance sparks an acceleration in bank deposit outflows. When this occurs, we expect the increasingly narrow advance will likely give way to a retest of the December 3850 low in the S&P 500. The equal weighted S&P is already getting close, consequently, it may be that the average stock holds up better than the index in our base case. In other words, the bulk of the selling is concentrated in the megacap tech names that have driven the recent advance, as well as financials. It is the latter sector that will prove the trigger for a monetary policy pivot. Policymakers will initially respond to an intensification of deposit flight and bear raids on bank equities with macro prudential measures, but as we learned in our discussion of the S&L Crisis, they will only delay the inevitable. We would be an aggressive buyer in this scenario, but let’s cross that bridge if and when we come to it.
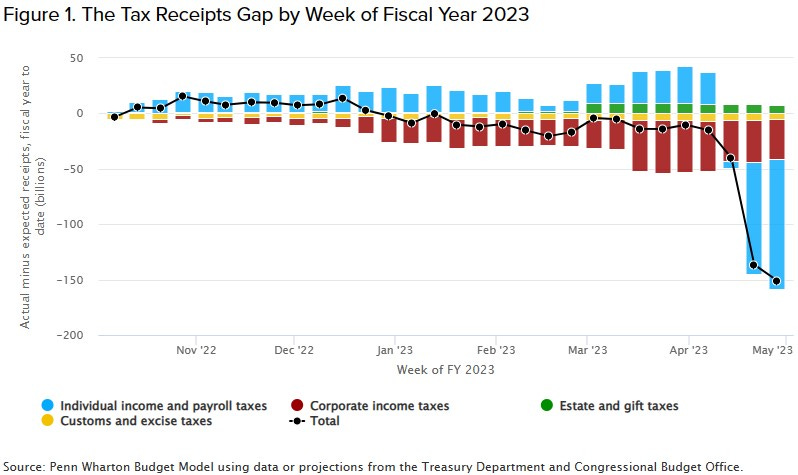
Before we end this week’s lengthy, but hopefully interesting and helpful, note, here is a quick update on the debt ceiling negotiations. The GOP’s hand was strengthened by the CBO reporting a $150bn receipt shortfall due largely to lower capital gains. We warned about this months ago, it is very much a repeat of the 2000-01 period. Budget cuts, returning unspent pandemic funds and perhaps even permitting reform are coming, work requirements on Medicaid and food stamps are likely to hit the cutting board. The probabilities still favor a short-term suspension until the end of the fiscal year September 30, which will then get extended further in a continuing resolution (CR) so that the entire package can be jammed into an omnibus spending bill passed on Christmas Eve so cumbersome that the concessions will be partially obfuscated. We cannot stabilize the debt and interest service with discretionary spending caps, ultimately that requires mandatory spending but spending caps that slow transfer payments will help to stabilization inflation, though as we wrote earlier, above the Fed’s target.
Why the Debt Ceiling Deadline is Closer Than Previously Expected, Penn Wharton Budget Model
Key Investable Themes & Asset Allocation:
Deglobalization & Capital Spending Boom: Industrials XLI -0.14%↓
Technology Innovation Diffusion: Healthcare IYH 0.00, Industrials XLI -0.14%↓ and Financials XLF -0.97%↓
Global Equity Allocation: Overweight US and UK equities SPY -0.38%↓, EWU 0.00, underweight export dependent economies (China FXI -1.20%↓, Germany EWG -0.48%↓, Japan EWJ -0.34%↓)
US Asset Allocation: Overweight equities SPY -0.38%↓, underweight Treasuries TLT 1.16%↑, overweight credit LQD 0.09%↑
Tactical trades: Buy 10-year USTs for a rally to 3.5%, one approach is the April TLT 101/107 call spread. Sold the call spread, bought TLT May 112 Calls. Buy S&P 500 105% Call, my MRA colleagues noted that since the SVB collapse the 95% put implied volatility is unchanged but the upside call is down 3% to 12.5%. This is a decent way to capitalize on a Fed pause.
Barry C. Knapp
Managing Partner
Director of Research
Ironsides Macroeconomics LLC
908-821-7584
bcknapp@ironsidesmacro.com
https://www.linkedin.com/in/barry-c-knapp/
@barryknapp