

Tale of Two Surveys
Growth Not So Scary, The Price of Labor, Stable but Hotter Inflation, Accommodative Policy, Asset Allocation Enhancements

Growth Not So Scary
The last couple of weeks have tested both of our equity market rally disruption scenarios, a retest of 5% for 10-year USTs, or a growth scare. As we will discuss in this week’s note, the wage component of the May employment report, despite the ‘tale of two surveys’, shifts the balance of risks back to a real rate shock. Treasury auctions in the belly of the curve, 2s, 5s and 7s, cleared well below the prior week’s price levels, traded below the when-issued price and put pressure on longer maturity prices. Just as a retest of 5% on 10s was inevitable in the near-term, a negative revision to 1Q personal consumption expenditures, a softish personal spending report, and associated drop in the Atlanta Fed GDP tracking model triggered a sharp rally in Treasuries that had bond king wannabees and equity investors long banks pulling forward rate cut expectations. To be fair, the investors we spoke to during our field trip to NYC were more inclined to be short duration, hinting the rally may have been exacerbated by a short squeeze. The employment report turned the tables on the growth scare scenario, and with a quarterly refunding of $58 billion of 3-year notes, $39 billion of 10-year notes, and $22 billion of 30-year bonds, May CPI and an FOMC meeting on Wednesday, 10s are likely to retest the recent high yield of 4.70%.
In this week’s note we will cover the tale of two surveys and wage growth from the employment report that was far from conclusive in settling the divergence between the more robust, albeit lagged, Quarterly Census of Employment and Wages (QCEW) on the one hand, and the monthly establishment survey on the other, as well as determine which had more definitive implications for the Fed policy path. Next up is a preview of CPI, focusing on our measure of price stability and the correlation of the components. The net effect of falling price volatility combined with higher trend inflation is stock market favorable for sectors with high fixed costs and leveraged to capital spending, but bond market negative, like the ‘60s. We move on to the FOMC, what is likely to be a yawner of a presser and our view of how policy is in fact accommodative despite FOMC participants’ prostrations to the contrary.
Our portfolio allocation, long equities benefiting from a secular capital spending boom, and short duration with a healthy cash position, is better positioned for continuing down the narrow path of a real rate shock rather than a growth scare. In the final section of this week’s note we are introducing an asset allocation framework, an enhancement to our equity sector model.
The Tale of Two Surveys
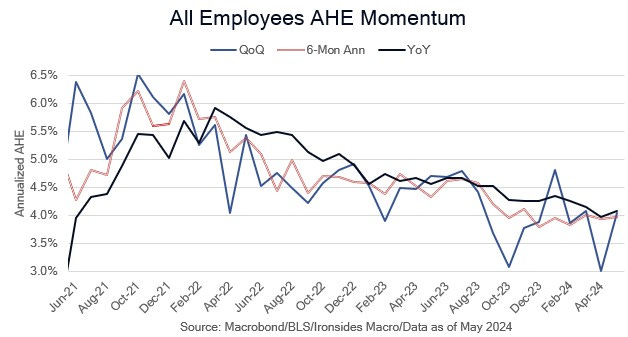
The debate over the divergence between the monthly survey of ~120,000 establishments and the lagged data from the Quarterly Census of Employment and Wages (QCEW) of 13 million businesses that we highlighted in our preview note intensified following the 272,000 increase in nonfarm payrolls and an increase in the unemployment rate to 4.0% for the ‘wrong reason’, namely a 408,000 decline in the household survey. The ‘on the one hand’ report also had a work week unchanged at 34.3, at the bottom of the range since 2010. The aggregate hours index, the broadest measure of labor demand in this report, is flat for the first two months of 2Q. While we suspect the FOMC and Fed staff are favorably disposed to our view that the establishment survey is overestimating demand for labor, a hotter than expected 0.4% increase in average hourly earnings and revision to March from 0.3% to 0.4% that lifted the annualized rate from 3.9% to 4.0% in April and 4.1% in May, settles the debate in favor of the establishment survey, for now. Recall the most credible wage measure, the quarterly employment cost index (ECI), increased 1.2% in 1Q led by a 1.4% increase for government workers. Combining the flat work week with hotter than expected average hourly earnings puts labor income growth at 5.5%, well above the 2019 4% rate.
As much as the divergence between the establishment and household surveys supports our view that small business employment is weak, if we were on the FOMC we could not in all good conscience support easier policy based on the weaker household survey and Conference Board’s decrease in jobs plentiful measure due to potential seasonal distortions. In particular, there was an increase in prime age employment that was more than offset by a drop concentrated in the 20-24 age cohort. The employment ratio for the 16-24 age group dropped to 50.9% from 52.1%, perhaps due to seasonal adjustment factors in the month that the college year ends. In addition to the curious drop in employment for younger workers, there was further evidence that immigration is adding to employment with native workers declining by 663,000 and foreign born increasing by 414,000 in May. On an annualized basis foreign born employment is +2.1% and native -0.2%. Finally, government employment resumed growth in May and is running at a 2.73% annualized rate, well above the private sector at 1.64%. The combination of questions about the household survey due to seasonal adjustment factors with strong foreign born and government employment growth, along with two plausible explanations for the robust monthly payroll numbers, is likely to intensify the natural rate (r*) debate at next week’s FOMC meeting.
There was a surge in flows from employed to out of the labor force and out of the labor force to unemployed that contributed to an increase in the job loss and leave rates, with the job finding rate at the low end of the longer run range. The reduction in churn evident in the monthly flows is consistent with the decline in our JOLTS reallocation measure, and given the 15-month lag in our reallocation wage model, we expect cooler wage growth in 2H24 into ’25. However, with the increase in 1Q24 ECI and stabilization of all workers and non-supervisory & production average hourly earnings above 4% in recent months, we cannot dismiss the tight labor supply hypothesis. The stabilization in average hourly earnings near 4% should increase the focus on the non-housing services (super core) component of CPI on Wednesday.
On balance, the wage component of the May employment report moves the most probable disruption event for the equity market rally back to a real rate, bear steepening, 10s retest 5%, shock from a growth scare. The picture may change when 2Q ECI is released in late July, the Atlanta Fed updates their wage tracker, and the initial estimate of the benchmark revision is released in August, but for now wage growth looks like the primary impediment to the FOMC beginning to reduce rates towards their forecast of r*. Our asset and sector allocation are better positioned for a rate shock than a growth scare. Details in the final section.
Inflation Preview
On the morning of the second day of the June FOMC meeting the Bureau of Labor will release the May consumer price index report. The current Bloomberg consensus is for a 0.1% monthly increase in all items (headline) CPI to a 3.4% annualized rate, unchanged from April. Core CPI is expected to increase 0.3% monthly and 3.5% annualized, in April core CPI increased 0.3% and 3.6%. During 2H23, following the low in all items at 3.0% in June, the decline in core inflation from 4.8% to 3.6% was primarily attributable to a decline in core goods prices from 2.0% in May ‘23 to -1.2% in April ‘24, as well as a modest cooling of housing inflation primarily due to a comp effect. There are a couple of underlying themes; the first is the lapping of the pandemic policy panic and supply shock peaks. Energy peaked in July ‘22, food in August ‘22, non-housing services (super core) in September ‘22 and housing services (rent of shelter) in February ‘23. Our view a year ago was that all items would bottom in June and core would continue to decline until 2Q24 if for no other reason than the comp effect. This approach is not economics, it is simple math, however, there are three important themes that developed in Chair Powell’s November ‘22 inflation framework analyzing trends in core goods, housing and super core inflation. Before we leave the new inflation math, goods, rent of shelter and super core comps are not market friendly from June through September. The May comps are favorable for core goods (0.42%) and rent of shelter (0.53%), but not for super core (0.08%) when it had its softest reading since September ‘21. The FOMC’s bias to ease has led to shifting metrics, for a time 6-month annualized inflation was all the rage, now they seem to be focused on the annualized rate. On balance, consensus May readings will probably be viewed by the Committee as number two in Governor Waller’s 3 to 5 good readings sufficient condition for a cut hurdle. However, the comps are the trends we discuss below that hint the progress could stall.
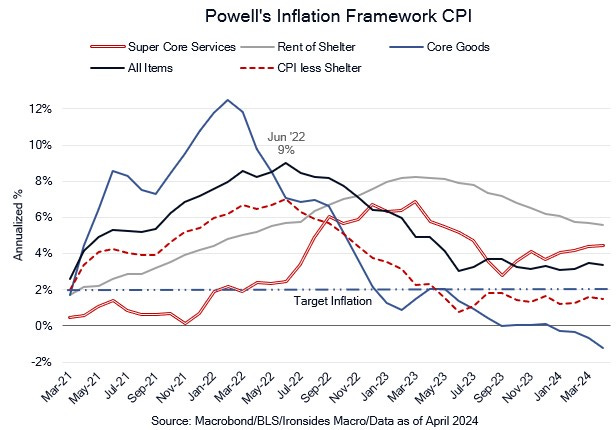
On the FOMC’s path to target inflation they ran into a super core speed bump that could be a barrier. From the peak in September ‘22 through July ‘23 it appeared that super core services inflation had returned to the pre-pandemic trend, with the median monthly change at 0.21%. Since August ‘23 it reaccelerated to a median monthly increase of 0.40% with only one month at 0.2%, only in that case just barely (0.247%). The above prior business cycle trend increases in core services prices is consistent with strong services consumption and government transfer payments to individuals as a percent of disposable income 1% above the pre-pandemic rate. The Fed has another inflation issue that could prove intractable, housing services inflation. Above we show ex-housing inflation, an approach we no longer think is appropriate due to reacceleration in rents and house prices.
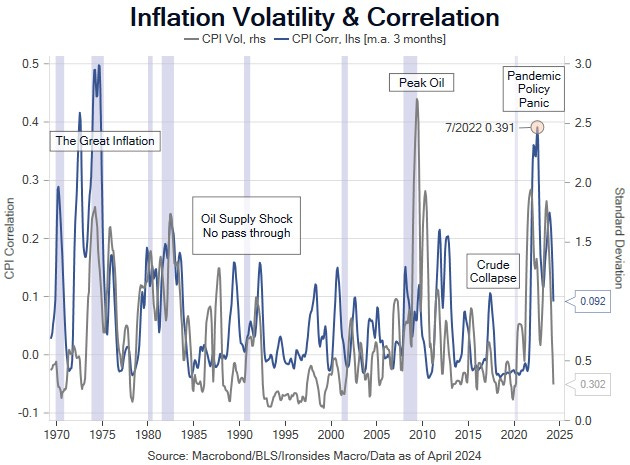
After the April CPI report we discussed the decline in inflation volatility to make the point that inflation that was above Fed target but stable was not an impediment to robust earnings growth, particularly for sectors with high fixed costs. It is an issue for the Treasury market, and an even bigger issue with 10-year nominals at 4.28% and 10-year TIPS at 2%. While inflation volatility, measured here as the standard deviation of annualized all items CPI, has fallen to pre-pandemic levels, correlation of the major components remains elevated. If it remains high, it is likely that policy accommodation from Fed unconventional measures (balance sheet and guidance) and, to an even greater extent, fiscal policy, are increasing aggregate demand beyond the capacity of the economy to absorb.
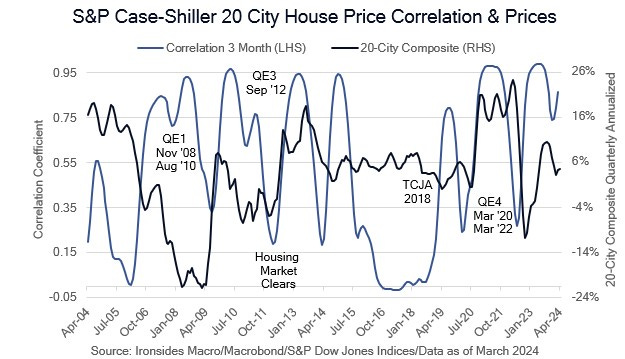
The correlation of the 20 cities that comprise the Case Shiller Composite Index illustrates our Fed balance sheet accommodation thesis. During the first year of the tightening process correlation and prices fell in lockstep, however, that period didn’t last. Correlation is high and house prices are increasing, suggesting an exogenous factor, most likely policy, is boosting prices. House prices were once thought to be most sensitive to regional forces, but that does not appear to be the case at present.
In short, we expect a May report that is unlikely to have a major impact on the monetary policy path or core equity market fundamentals. We remain convinced that until and unless the Fed begins the process of shortening the duration of the SOMA portfolio and our elected officials start down the path of running a primary surplus, reaching the Fed’s 2% target for anything more than a transitory period is improbable.
FOMC Preview: Unconventional Accommodation
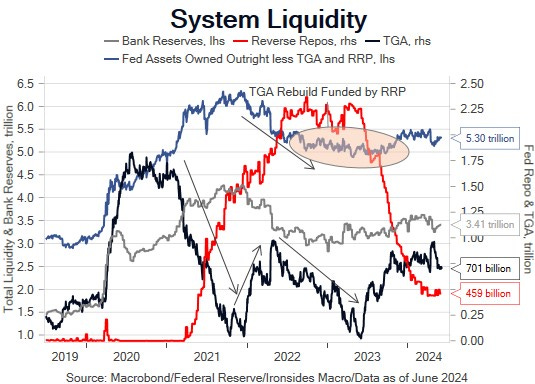
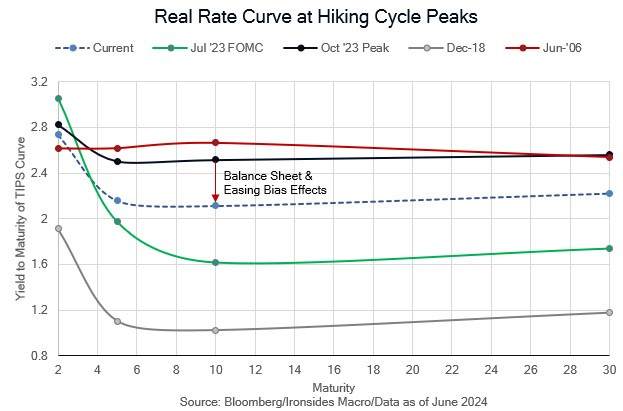
If we were attending Chair Powell’s press conference on Wednesday, we would have two questions. The first would be whether KC Fed President Schmid and Governor Bowman’s view that they should shorten the duration of the SOMA portfolio is gaining traction. Our second question would press him for details on the r* debate beyond the Summary of Economic Projections (SEP) longer run forecast. Of course, we would love to draw out the Chair and Committee’s views of the influence of exceptionally accommodative fiscal policy on the inflation outlook, but that would be an exercise in futility. It is getting increasingly difficult for the Committee to argue that policy is tight and justify the reduction in QT. Abundant liquidity as evidenced by an increase in bank reserves, stabilization in the RRP balance and the TGA, suggest rate policy and QT are not restrictive. The rally in nominal and inflation-protected Treasuries from the October peak suggest the stock of the Fed’s portfolio with a longer than Treasury index duration combined with the bias to ease, is providing accommodation to longer term capital formation. Finally, economic activity, wage growth and inflation, suggest that total policy, both conventional and unconventional (balance sheet and forward guidance) as well as fiscal policy, are some ways from providing restriction. We doubt the Chair will acknowledge any of this, consequently, our expectation for Wednesday is that we may doze off in our office chair.
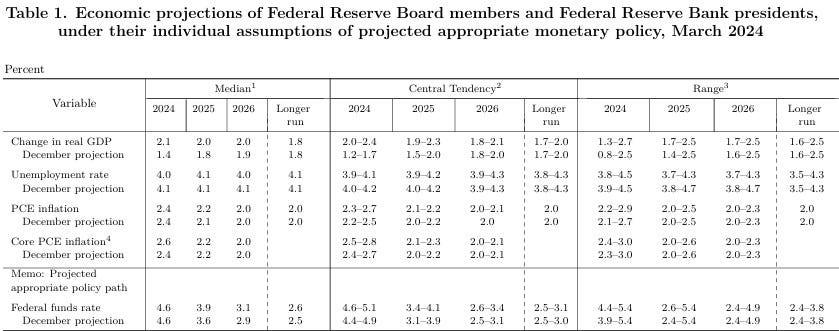
The update to the SEP is unlikely to change much in the first four rows (GDP, U3, PCED and Core PCED). The focus will be on the final row, in particular the ‘24 and ‘25 projected rate path and perhaps the longer run policy rate (r*).
Introducing Our Asset Allocation Framework
As promised after we enhanced our equity sector allocation process and recommendations, here is our US asset allocation framework. The benchmark is a 60 (equities) / 40 (fixed income) approach. We utilize the old Lehman, now Bloomberg, indices for our fixed income benchmarks. The index weights are derived from the US Agg Index, the yields, volatility and spreads are from the US Corp Agg, US MBS and High Yield indices. Term premium on short, intermediate and long-term indices are the 2-year, 5-year and 10-year Adrian, Crunch & Moench measures available on Bloomberg. The next step in this portfolio development process is to run total portfolio statistics integrating cross asset correlation. We will get there.
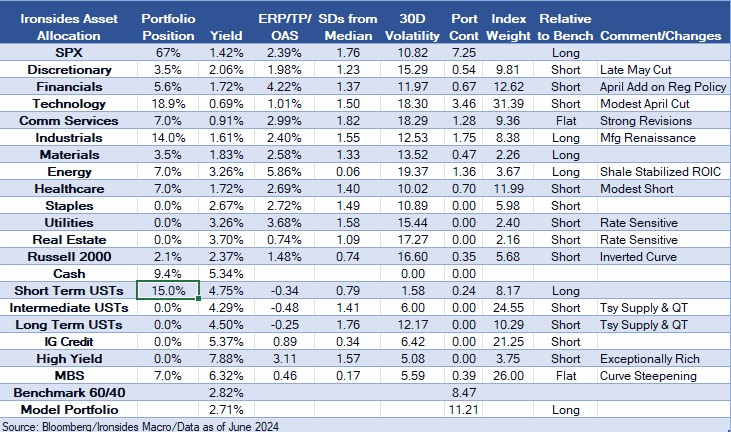
Our current recommendation is similar to our narrative recommendation for equities and fixed income; we are underweight fixed income and short duration with a 15% allocation to short -term Treasuries, 5% in cash and 10% in agency MBS as our hedge that the economy weakens, and the Fed starts down a policy path to 4% and yield curve disinversion. The sum of our equity and fixed income sector allocation volatilities is slightly greater than an all-equity allocation at 11.37%, and well above the 60/40 benchmark index cumulative volatility of 8.53% (S&P 500 and Barclays Agg). In short, we are long equities and short duration.
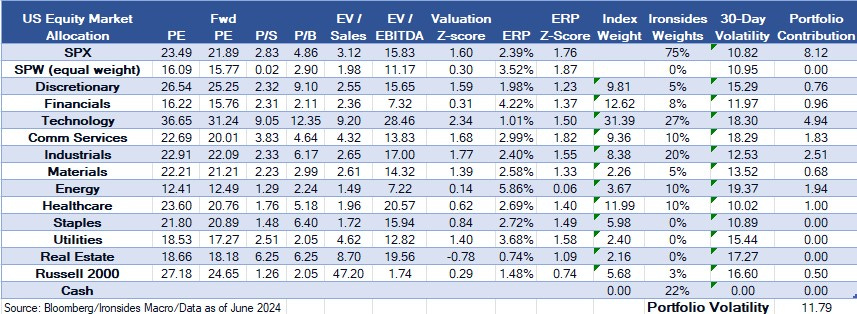
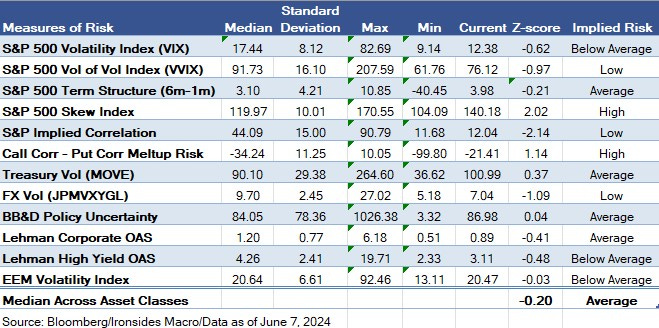
There are no changes to our equity sector allocation, we added 3% to financials in April funded out of the tech sector. Last week we reduced consumer discretionary by 5% and put the proceeds in cash. Due to the strong relative performance of the technology sector our marginal underweight of 3% is now 4.4%. We suggest you check your exposures and not allow technology risk to sneak up on you. It was pointed out to us by our colleague Dean Curnutt that Nvidia skew is upside down, upside calls are rich and puts are cheap beyond the interest rate effect to extreme levels. Additionally, implied correlation at 13.5% is in the ‘0 percentile of the last 5 years’, in other words, crazy low. We have long maintained that low volatility and correlation tend to persist, vol and correlation spikes tend to be brief. Our portfolio positioning should perform reasonably well in a real rate shock driven risk-off episode, with cash positioning us to add risk in this outcome. It should also perform well in an above Fed target, but stable, inflationary regime. A deterioration in growth is our worst-case scenario, however, with government spending at record non-recessionary levels and Fed unconventional policy accommodative, a recession is a low probability fundamental outcome.
Barry C. Knapp
Managing Partner
Director of Research
Ironsides Macroeconomics LLC
908-821-7584
bcknapp@ironsidesmacro.com
https://www.linkedin.com/in/barry-c-knapp/
@barryknapp