

Shifting Winds
Developing dovish dissenters, inflation political wind shift, the inflation train, the slowmo taper tantrum, early earnings results, lots of charts this week

Note: We removed the paywall this week, it has been a couple of months since we offered our free subscribers a look at what you’re missing. Hopefully you will consider becoming a full subscriber.
The Three D’s: Developing Dovish Dissenters
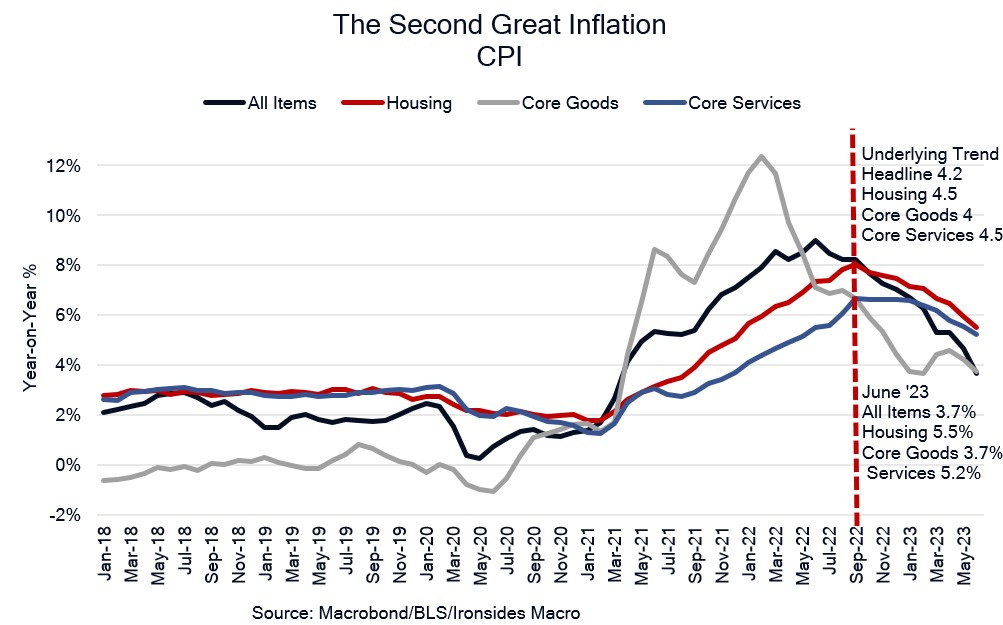
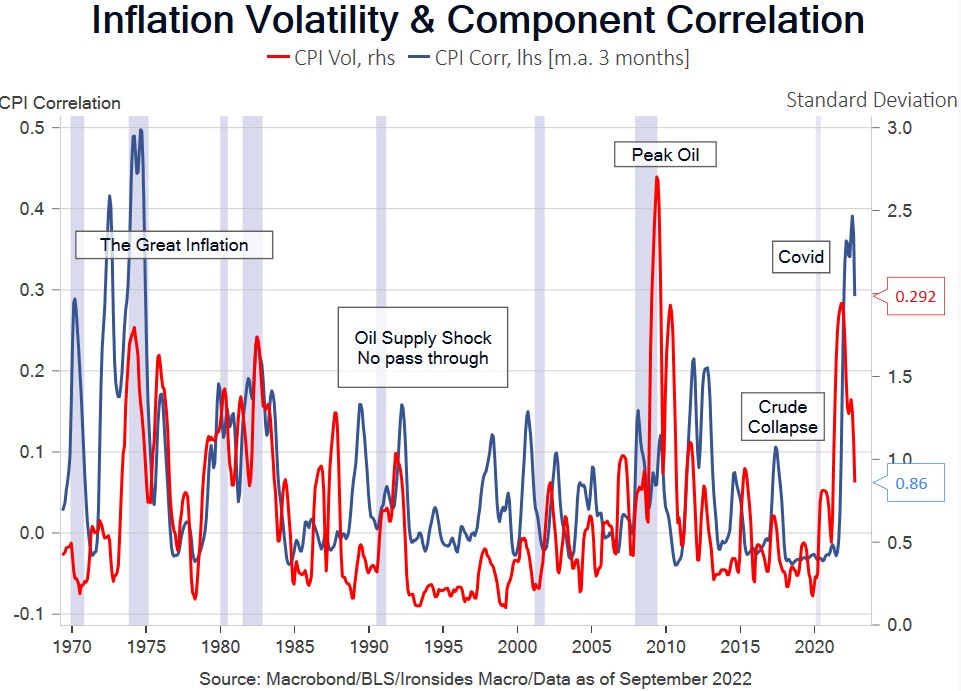
The September CPI report had very little impact on our expected path for inflation through 2H23. After inputting the September results, our forecast for June ‘23 all items CPI increased from 3.6% to 3.66%. The composition, softer core goods prices and firmer services inflation, does not augur well for the attribution of fiscal inflation and efficacy of monetary policy, but the road from 8% to 4%, remains open. Food inflation finally peaked, energy continues to come down, core goods prices resumed their steep descent after a 0.0% monthly change, the rate of change of shelter costs is flattening out, and the correlation of the top 20 components has fallen from .42 in June, the highest level since the early '70s, to 0.2 in September. In other words, the price pressures are narrowing.
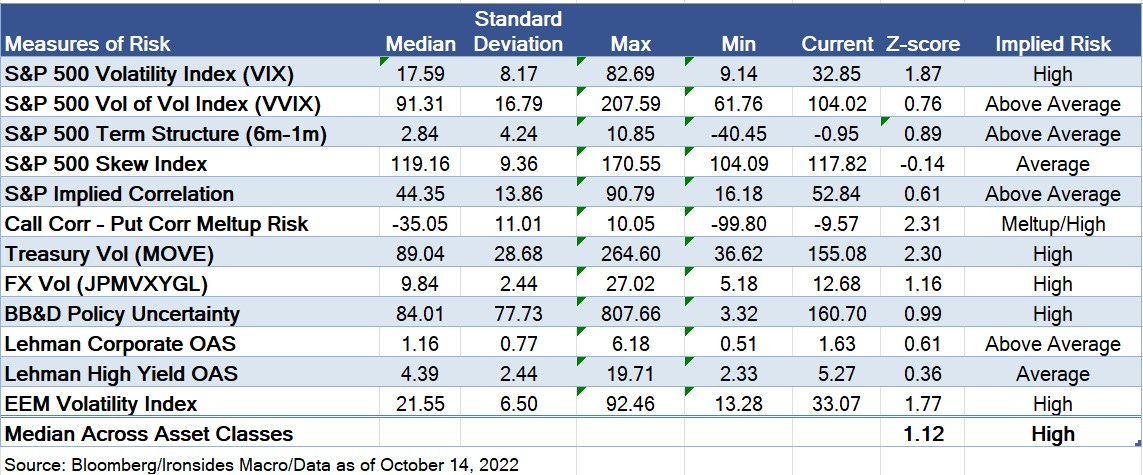
Our gauge of equity market meltup/meltdown risk, the correlation of 10% out-of-the-money calls relative to 10% out-of-the-money puts, was even more skewed towards a meltup ahead of Thursday’s CPI report than when we first introduced the concept in last week’s note. Consequently, when we left a 90-minute meeting at 12:30 in NYC we shouldn’t have been shocked that the S&P 500 had rallied from -20 to +80, though we did a double take when we checked our iPhone Bloomberg app. However, while positioning and sentiment are necessary conditions for a sustainable rally, they are not sufficient. To turn what we believe is the last of the ugly inflation reports into a year-end rally in risk likely requires further confirmation that Chairman Powell’s “inflation is job one” consensus is breaking apart due to tighter financial conditions, the lagged effect of policy tightening and the shifting political winds of inflation.
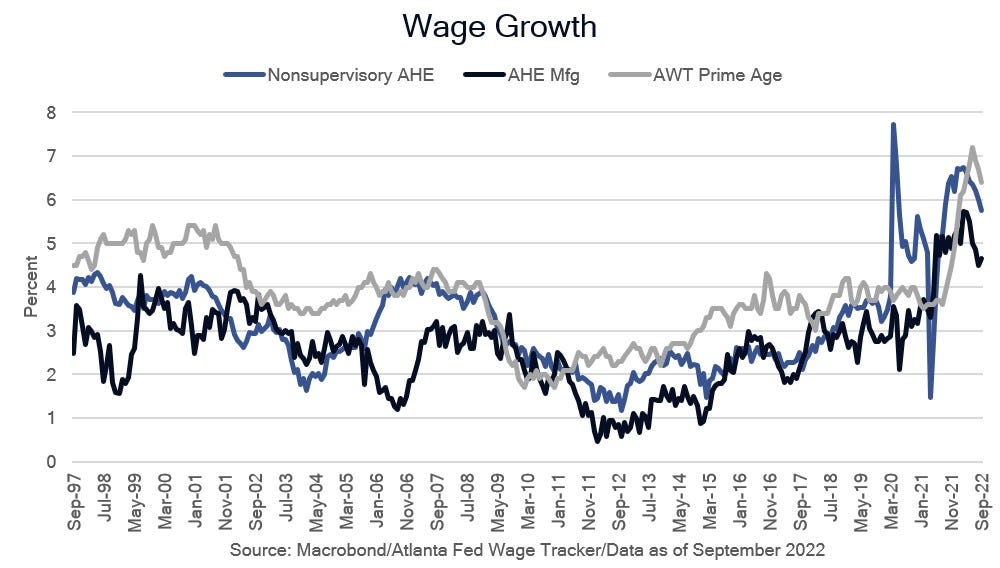
We’d like to hear from the developing dovish dissenters, Brainard, Evans, George and perhaps Daly, that the FOMC is dependent on more than just bad data. In fact, there was some favorable inflation news on Thursday that most investors likely missed: the September Atlanta Fed Wage Tracker, a 3-month moving average, slowed from 6.7% to 6.3%, prime age worker wage growth was 6.4% from 6.7%, hourly wages were 6.4% from 6.9% and the strong momentum of wages for job switchers finally reversed from 8.4% to 7.9%. This confirms the 1% drop in nonsupervisory average hourly earnings from March through September from 7% to 6%, leaving little doubt that the US economy is not experiencing a wage price spiral. It seems probable that the 3Q employment cost index, due the Friday before the November 2 FOMC meeting, should slow noticeably. The incoming data on wage growth, car prices, goods, energy, food, house prices and rents are not sufficient to turn the Fed 75bp battleship before the November 2 meeting but as we will explain, the political winds are shifting. The equity, fixed income and exchange rate market struggles hasn’t been about inflation for some time, it has been about the Fed’s reaction to inflation. The window for a year-end rally is closing, though not yet closed.
It was the Feds, It was the Feds
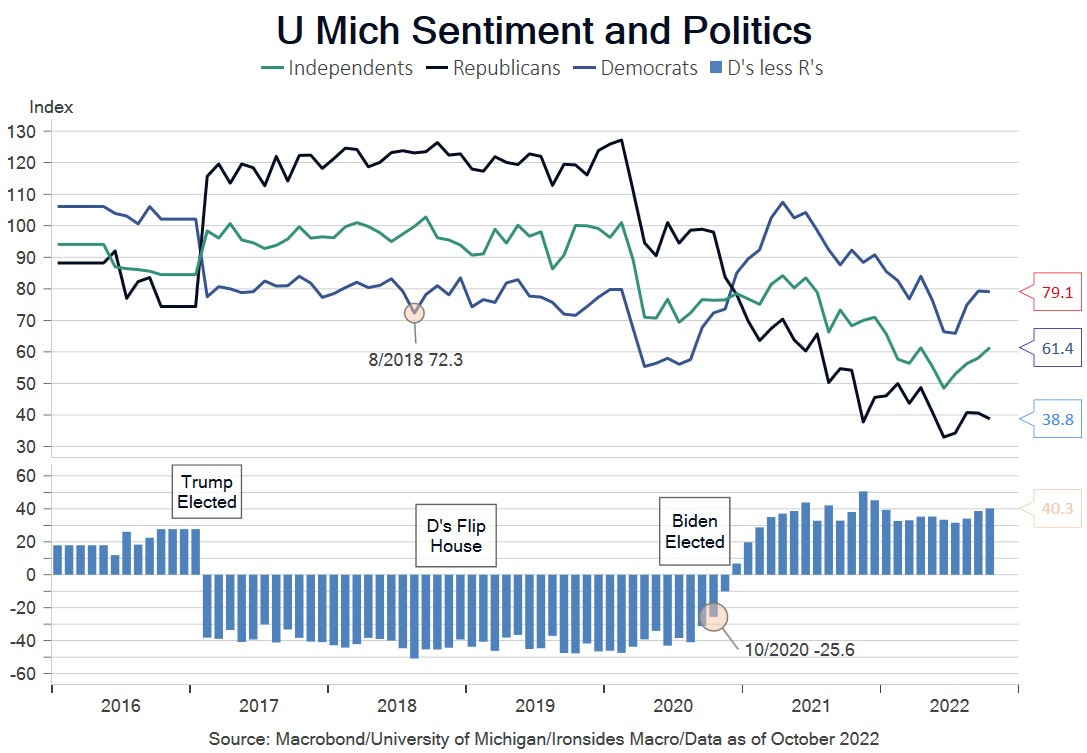
Before we discuss the details of the second consecutive unfriendly consumer price index report, we want to explain our assertion that the political winds are shifting. It is not speculation to infer the administration’s first choice for Fed Chair was Lael Brainard, since former FOMC participants have said as much on financial television. The surge in inflation, and the public’s response (namely plunging consumer confidence even as the unemployment rate recovered to pre-pandemic levels), forced the President’s hand and he reappointed a Republican Federal Reserve Chairman. Our 2022 outlook note, Inflation Policy & Politics, discussed how inflation shifted the Democratic Party from their inclusive employment goals to support for tighter Fed policy, hoping monetary policy could resolve a problem that was a supply shock exacerbated by the most aggressive combination of fiscal and monetary policy stimulus ever attempted, at least in the US. Tolerance of the most aggressive monetary policy tightening since the Volcker regime is likely to shift following the November 8 midterms. Consider the response of a Democrat running for national office to a question about inflation: when the candidate expresses support for Fed policy tightening, they are deflecting blame for inflation by channeling Milton Friedman’s line about how inflation is a monetary phenomenon. In other words, my votes for $5.3 trillion in stimulus had nothing to do with 8% CPI, it was the Feds, it was the Feds (Dukes).
Of course, both parties spent exorbitant amounts of taxpayer money, however, the consumer confidence surveys implies that the public understands that there was only one bill passed strictly along party lines after the economy was clearly recovering, and inflation surged shortly thereafter. This is not a partisan observation, given that prominent Democratic economists including Larry Summers and Jason Furman have also reached this conclusion. Assuming our assessment of the political mood is correct, and the Republicans take back the House, we expect support for aggressive monetary policy tightening to weaken and suspect that Vice Chair Brainard’s two balanced speeches in 10 days and Treasury Secretary Yellen’s recognition of diminished Treasury market liquidity and associated financial stability risks is an early sign of the shifting political winds. Consider the narrative likely to develop with Republicans and Independents in 2023: first the Democrats caused inflation, then they tried to fix it and caused a recession. It almost fits on a bumper sticker.
Please do not misinterpret our line of thought. Whatever the FOMC’s motivation, political or not, we agree the financial risks are growing, the signs inflation has peaked are clear, the Phillips Curve model is flawed, and monetary policy works with long and variable lags. It is time for the Fed to take a look around, as Bianchi detailed in Inflation as a Fiscal Limit, the costs attempting to fix fiscal inflation with monetary policy are prohibitive. There is no change to our view that the neutral rate that investors appeared to believe was close to the peak of last cycle’s terminal policy rate at 2.5%, is at least 4%. This week’s retail sales control series, deflated by core goods ex-autos CPI, showed a 5.3% 3Q22 annualized increase and boosting the Atlanta Fed GDPNow tracking estimate to 2.9%. The private sector can withstand a policy rate above 4%, the issue is the panicky pace of tightening and implications for asset prices and the global energy crisis. The 2% target was conceived in the globalization era due to an obsession with the zero lower bound, misdiagnosis of the nature of disinflation and interventionist Fed, it won’t be easy to extricate themselves from the trap they set but the process should begin.
*GEORGE: DO SEE RISKS IN MOVING TOO FAST TO THIS HIGHER LEVEL
Sometimes the Light at the End of the Tunnel is a Train
Core goods prices, the initial source of surging inflation, were flat in September from August, reducing the monthly rate to 6.7%, down sharply from the February peak of 12.4% due to the surge of imports and repairing of global and domestic supply chains. The improvement in direct pandemic related inflation came despite a monthly increase of 0.7% for new car prices and a 1.1% drop in used cars that portends softer new car prices in coming months. There was additional favorable news Thursday evening with Chinese manufacturing PPI falling 1.9% from a year ago. The monthly change in food prices remains hot at 0.7%, however the rate of change is decelerating from the 1.1% monthly average from May through July, leading to a marginal reduction of the annualized rate to 11.2%, 4.5 standard deviations above the ‘20s median. Energy fell 2.1% from August, 19.9% above a year ago, but down from the peak of 41.5%. Goods can be categorized as first order pandemic effects, food and energy pressures began with the pandemic and were exacerbated by pandemic policies and the Russian Invasion. The contributions to CPI of 1.4% from core goods, 1.4% from energy and 0.2% from food are likely to be the primary drivers on the road from 8% to 4% over the next 9 months.
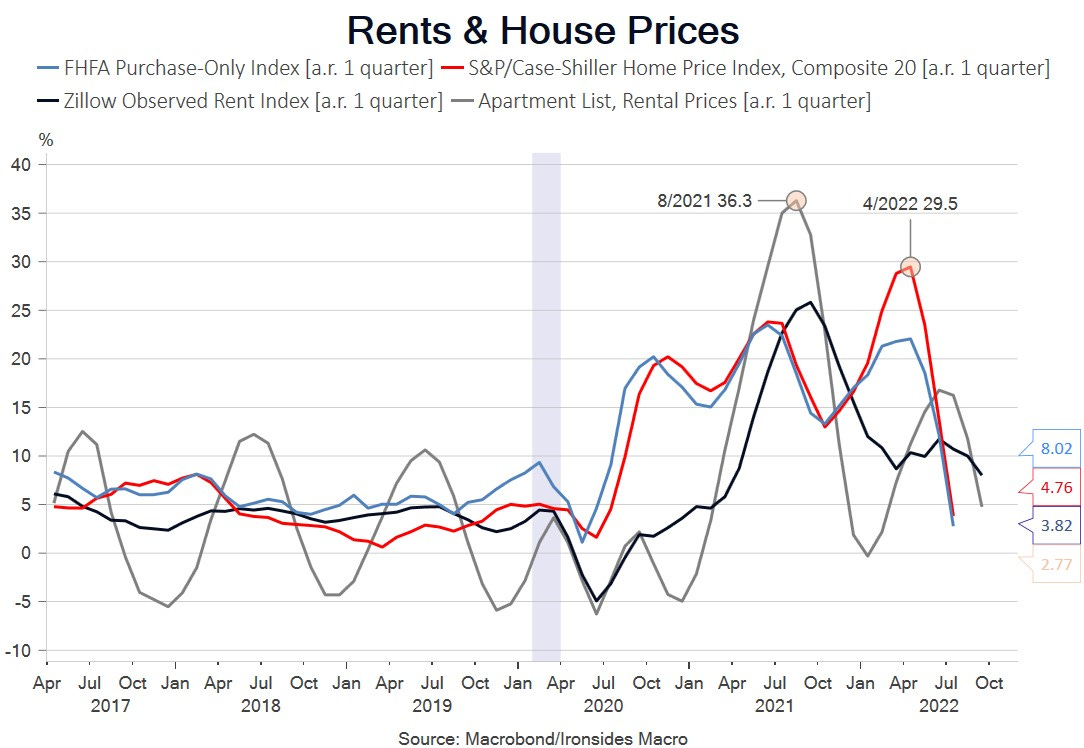
If the light at the end of the tunnel turns out to be (some might say continues to be) an oncoming train it will be attributable to services inflation. Core services increased 0.8% from August, the hottest monthly change of the cycle pushing the annualized rate to a new cycle high of 6.7%, contributing 3.9% to all items CPI, 4.6 standard deviations above the 20-year median. Shelter contributed 2.2% to CPI, the monthly change is no longer surging, and the outlook is improving due to easing house prices and rents. Medical care services continued to the recent surge due to health insurance and is now 6.5% above a year ago, contributing 0.5% to all items CPI. There was widespread evidence of the lagged effect of pandemic policy as well as the rebalancing of demand for goods to services; physicians, veterinarians, airfares, auto repair and insurance were examples of surging services prices. Given the unique characteristics of this cycle, monetary policymakers should be careful not to treat the rebalancing related surge in demand for services as an underlying trend. Nevertheless, even as pandemic effects recede, the Social Security Administration announced the 2023 adjustment is 8.7% and federal government interest expense is surging, increasing the risk of a fiscal inflation spiral as the government increases borrowing to continue its spending programs. A fight over the budget and the debt ceiling in 2023 between a Republican House and the Administration is increasingly likely.
Looking for Risk in All the Wrong Places
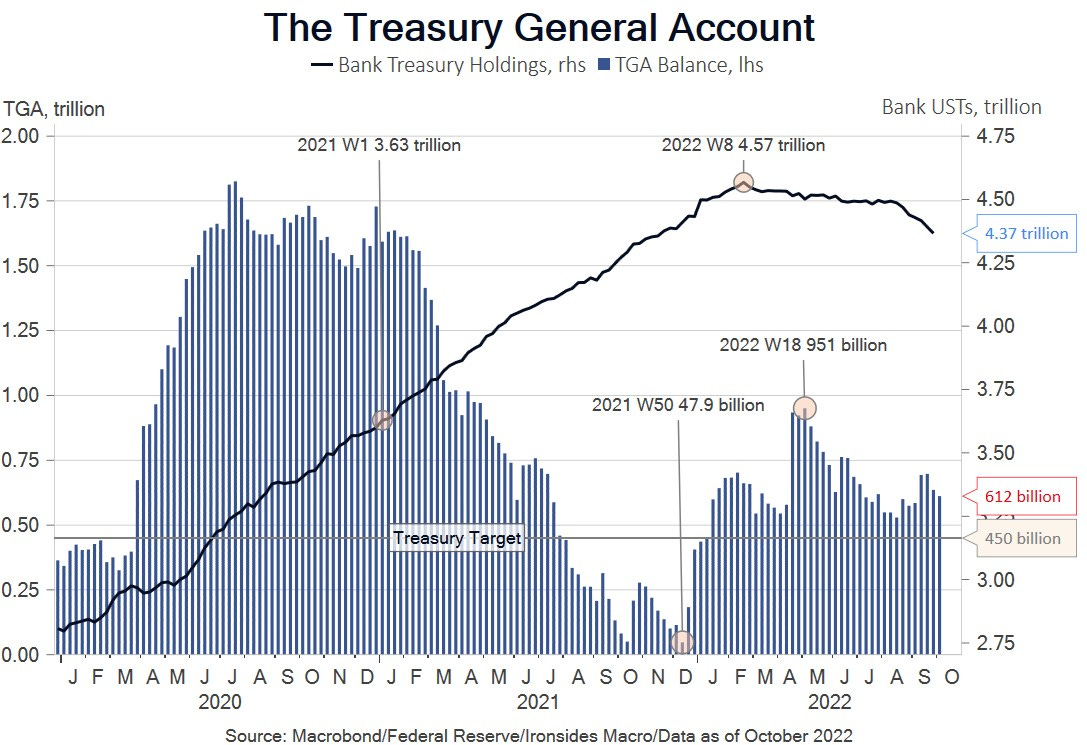
During our trip to NYC, we had numerous discussions about the implications of the failure of the 60/40 strategic asset allocation model. The issue we kept returning to is who will buy the bonds? In other words, after two decades of relentless central bank buying of the securities at the core of the global financial system, US Treasuries, financed by increased bank reserves (increased money supply), that demand is gone, with most investors convinced inflation will prevent a resumption of global QE. Meanwhile, central bankers appear to be looking to money markets and the banking system for signs of stress as if we were back in 2007 when maturity transformation (borrowing short and lending long) triggered a ‘run’ on repo/SIVs/CP that led to liquidation of illiquid assets with deteriorating credit quality.
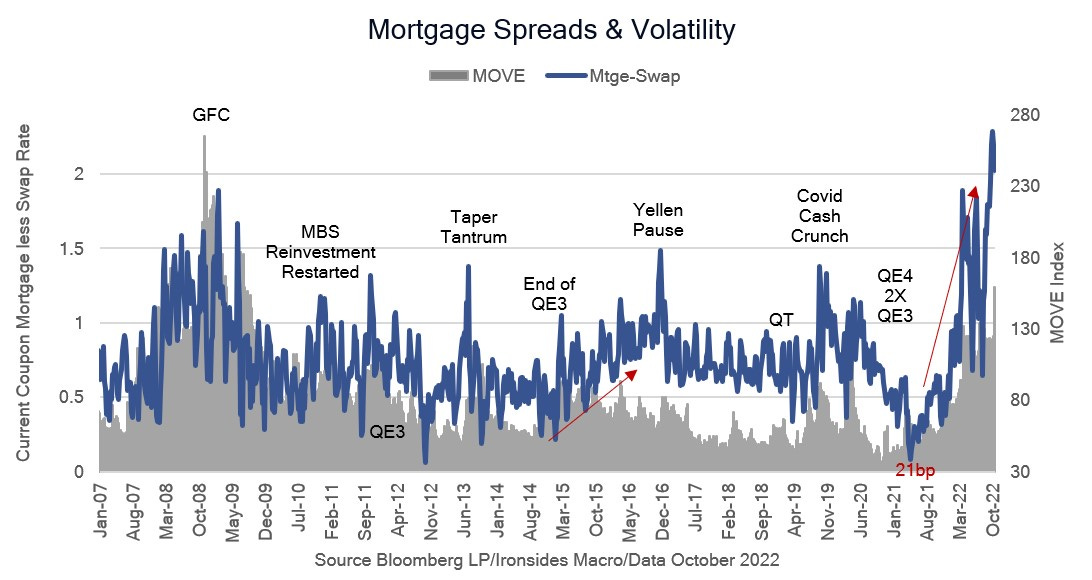
The current situation is quite different. Banks continue to willfully shed unwanted deposits resulting from the Treasury Department and Federal Reserve counterproductive injection of $3+ trillion of reserves in 2021 that were more trouble than they were worth due to regulatory constraints. The signs of stress are in the ‘soft underbelly’ of the curve. The average duration of QE was ~6 years, and with that demand gone, the record wide mortgage basis, poor Treasury liquidity and unsustainably high interest rate volatility, the gilt market, Italian BTPs (government bonds) spreads to German bunds are where the stress resides. The gilt saga is particularly telling, just prior to the Bank of England start date for outright sales, a hawkish Fed meeting triggered chaos that the BOE, and market participants blamed on a reasonable fiscal plan from the new government. Even as the Truss government ‘listened’ to the markets and Keynesian monetary policymakers and reversed course, the gilt market still cratered. The soft underbellies (intermediate maturities) of sovereign bond markets are extremely vulnerable with the end of global QE. All of the excess liquidity sloshing around the system and the Fed reducing their holdings of mortgage-backed securities only $28 billion under their passive QT program appears to be misleading policymakers into believing financial conditions are stable. The combination of regulatory policy and the loss of demand from the Fed and foreign central banks, as well as a decade and a half of investors reaching for yield due to the Fed holding the policy rate at zero for most of that period, has left a hole as big as if George Baily had never been born. We will never know if our counterintuitive counterfactual approach to policy tightening (more QT, less rate hikes) would have been more efficacious than front loading of their primary policy tool because there’s no turning back now. Said differently, QT running in the background on autopilot is crashing into an iceberg. Real rates in the belly of the Treasury curve above 150bp are reasonable from a valuation perspective, however the question remains, in the absence of central banks, who will buy the bonds?
*US TREASURY 30-YEAR YIELD RISES TO 4%, HIGHEST SINCE 2011
*YELLEN SAYS FED'S STANDING REPO CAN BE HELPFUL FOR LIQUIDITY
*YELLEN: WORRIED ABOUT LOSS OF ADEQUATE LIQUIDITY IN TREASURIES
It’s Early But, So Far So Good
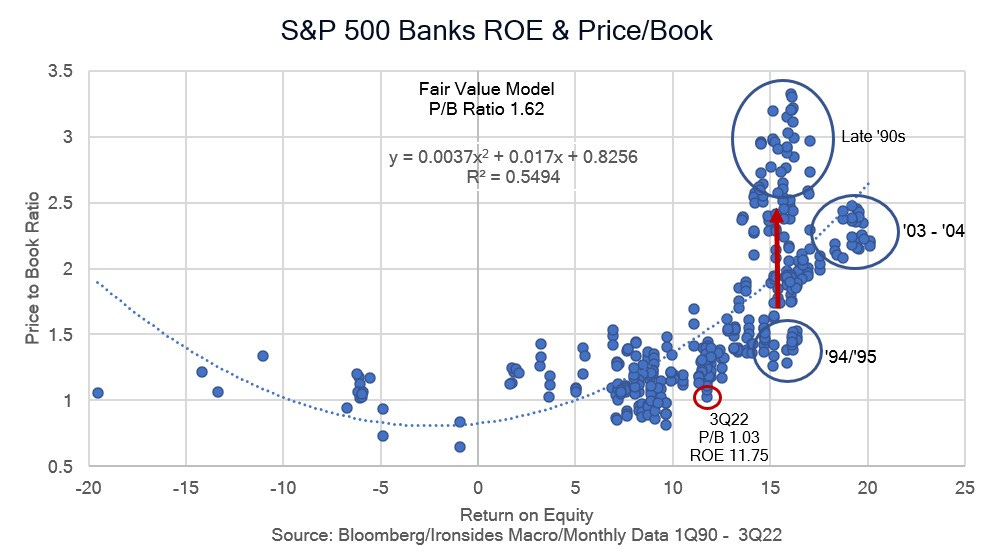
The market response to surging bank net interest income and improving net interest margins, with little evidence of credit deterioration, was favorable. Shortly after the opening Friday, following results from JPM, WFC, C, MS, USB, PNC and FRC, aggregate surprise was 8.9% and the stocks were averaging a 3.7% gain. A simple model of the relationship between price to book ratio of 1.02 and the 11.75% return on equity suggests 68% upside. While that sounds unrealistic, that is essentially what occurred following the ‘94 aggressive rate hike cycle. In addition to the banks there was a smattering of results that offered evidence of decent consumer spending consistent with September retail sales: Pepsi (nondurable consumption), Delta (services demand), Walgreens and UnitedHealth (healthcare). We heard from a number of investors this week that they expected S&P 500 earnings to drop 25-30%. A decline of that magnitude is not consistent with the history of recessions during the Great Inflation when nominal growth kept expanding despite declines in real GDP. Although it is very early, earnings surprise is close to 4%.
We will have to wait two weeks to hear from big tech. We heard a couple of tech investors last week covering public markets, venture capital and private equity, and while the conference was held without press under no attribution rules, suffice it to say they were in full 2000-2002 tech bubble bursting mode. Our perspective, stretching back to our first downgrade of the sector in approximately a decade in August 2021, continues to be that while the pace of investment and innovation in the sector is likely to slow in the ‘20s, the pace of technology innovation adoption, or diffusion, across a broad range of economic sectors that picked up momentum in the late ‘10s, will accelerate further in the ‘20s. In other words, the benefits of digitization and the cloud will accrue to the consumers of technology rather than the producers. We do not expect the contraction to be as deep or protracted as the ‘00s because the investment boom was primarily in software rather than hardware. The depreciation rate is faster for software and the infrastructure investment associated with the ‘10s boom is in much stronger hands than the ‘90s. Technology related assets certainly got way overvalued during the ‘10s boom, partially due to Fed interest rate and volatility suppression. Consequently, we do not believe the process of valuation rationalization is complete, however we would stop short of describing the digitization/cloud boom as malinvestment. The benefits should boost trend productivity growth through the decade.
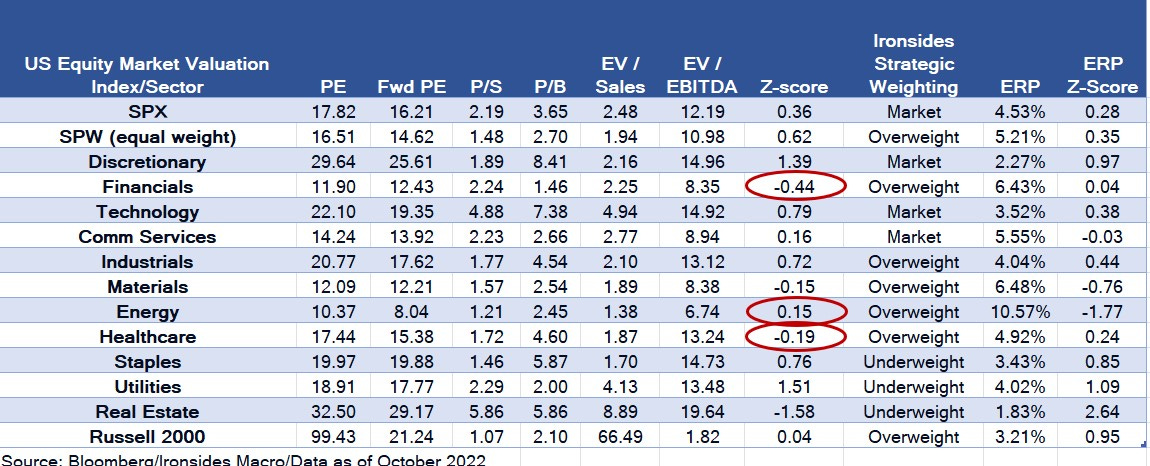
Key Investable Themes & Asset Allocation:
Deglobalization & Capital Spending Boom: Industrials XLI -0.14%↓
Resilient Growth: Materials XLB 0.22%↑, Financials XLF -0.97%↓ IAT 0.00, Energy XLE -0.86%↓ XOP -0.67%↓, Small Caps IWM -0.40%↓
Technology Innovation Diffusion: Healthcare IYH 0.00, Industrials XLI -0.14%↓ and Financials XLF -0.97%↓
Global Equity Allocation: Overweight US and UK equities SPY -0.38%↓, EWU 0.00, underweight export dependent economies (China FXI -1.20%↓, Germany EWG -0.48%↓, Japan EWJ -0.34%↓)
US Asset Allocation: Overweight equities SPY -0.38%↓, underweight Treasuries TLT 1.16%↑, overweight credit LQD 0.09%↑
Portfolio Hedging: Equity index skew (downside puts) is cheap. We would suggest removing part of your hedge if you caught the ‘aftershock’ correction.
Barry C. Knapp
Managing Partner
Director of Research
Ironsides Macroeconomics LLC
908-821-7584
bcknapp@ironsidesmacro.com
https://www.linkedin.com/in/barry-c-knapp/
@barryknapp