

Not So Hot
In our 2006 outlook, the only scenario where 10s would fall below 4% was much weaker than expected growth, cyclical stocks look offsides and the Fed is behind the curve, again

This week’s note details a resetting of the economic outlook as the ‘run it hot’ consensus runs into restrictive rate policy and a slower than expected transition from the Biden Administration’s accommodative fiscal policy. Here is a summary:
Markets flashing growth concerns: Despite strong year-to-date performance in non-tech cyclicals, earnings expectations for 1Q26 have been cut sharply, and the Treasury bull flattening (falling real rates, deeper curve inversion) signals markets are aggressively marking down the “run it hot” growth outlook.
Earnings narrowing to AI beneficiaries: S&P 500 earnings growth remains near historical mid-cycle averages overall, but most strength is concentrated in tech and communication services tied to AI, while broader 4Q25 cyclical earnings growth was tepid and 1Q26 expectations were revised lower.
Bond market signaling Fed easing: The drop in 10-year yields and deepening 3m–2y inversion suggest rising economic weakness and increasing policy restrictiveness, with markets implying the Fed needs to resume rate cuts.
Credit stress emerging but not systemic: Weakness in BDCs, CLO equity tranches, and high-yield duration points to strain among lower-quality, floating-rate borrowers; however, overall credit growth remains subdued, making risks more idiosyncratic than systemic.
Capex boom not yet broadening: Regional Fed manufacturing and services surveys show tentative stabilization in current orders, but capital expenditure plans have weakened. S&P 500 capex remains heavily concentrated in the technology and communication sectors, suggesting broad-based investment remains elusive despite the powerful tax incentives in the One Triple B Act.
Payroll Payback: We preview next Friday’s employment report, in short, we see little evidence demand for labor has strengthened. A weak report should put rate cuts back in play despite resistance from Biden appointees and the regional repo rate resistance.
Cautious but not bearish outlook: While equities are vulnerable to a cyclical “growth scare” correction—especially in midterm years—we are less bearish than a year ago but are maintaining elevated cash positions looking for a better entry point to capitalize on our expectation of broader capital investment beyond AI later in 2026.
We are spending next week in NYC, keep your eye on the Substack chat function and our X feed for exact times of television appearances we have scheduled for Tuesday and Thursday.
With a lag, on Monday morning March 2, we are releasing the full note to free subscribers as we do once a quarter. Our intention is to tempt you to become a paid subscriber, we appreciate our clients subsidizing our work and tolerating our periodic sharing with those of us interested in our work, but not yet fully committed to Ironsides Macro’s, ‘it’s never different this time’.
Not So Hot
The narrative of the week was a dystopian labor market fairy tale with an underlying assumption that technology innovation adoption will be different this time, more on technology, productivity and the labor market later in the note. Putting aside that near zero delta (remember the tails of a normal distribution never actually hit the horizontal axis, in other words, never say never) outcome aside, we are struck by the divergence between the strong year-to-date stock performance of the non-tech cyclicals relative to their tepid 4Q25 earnings growth, and reduced 1Q26 expectations. Stock prices leading earnings growth is typical at inflection points, given our outlook for the three adverse aggregate demand shocks drag on earnings, consumption and investment, combined with the positive impact of the tax incentives from One Triple B, as well as the impact of the Treasury rally and tighter mortgage spreads on the housing market, we would be inclined to look through the weak 1Q26 outlook. But, and it’s a big but, the bull flattening rally in the Treasury market is not being driven by reduced supply or inflation risks as was the case in ‘25, instead the Treasury rally is strongly suggesting the ‘run it hot’ consensus view is being marked down aggressively.
When we wrote our 2026 outlook note, our base case was an acceleration in non-AI infrastructure capital investment that drove real rates higher, thereby triggering a risk-off, highly correlated equity market correction. When we went to NYC last December and discussed our outlook, the consensus was that the Administration would be successful ‘running it hot’ ahead of the midterms and our forecast for 10s rising to 4.5%, and 10-year TIPS increasing to 2.25%, leading to an equity market pullback was a reasonable base case outlook. As earnings season kicked off in mid-January the yield on the 10-year Treasury broke above the 4-4.2% range and our outlook base case scenario appeared on track.
As earnings season winds down, the Lipper Analytics 1Q26 expected earnings growth rate for everything but tech and comm services has been marked down from 9.8% at the beginning of January to 4.9%, and while the entire S&P 500 expected earnings of 12.2%, down from 14.4%, sounds reasonably strong, our approach to measuring post-war mid-cycle earnings growth in our reign as Barclays Equity Strategerist concluded that the median is 12.5%. In other words, the earnings growth is about average at this stage of the business cycle for the S&P 500, but very tepid for everything except the AI investment beneficiaries. The full year outlook was marked down as well, but only marginally from 15.6% to 14.8%. Given the consumption stimulus from tax refunds, expected impact of tax incentives on capital investment, potential improvement in residential investment from a steeper yield curve and bank regulatory relief, as well as the fading effects of the three adverse aggregate demand shocks - tariffs, reduced immigration, and slower government spending growth - we wouldn’t throw in the towel on the stronger, broader earnings growth, run it hot outlook, just yet. That said, from a tactical perspective, the equity market is vulnerable to a markdown of cyclical sectors, the type of pullback we characterize as a growth scare.
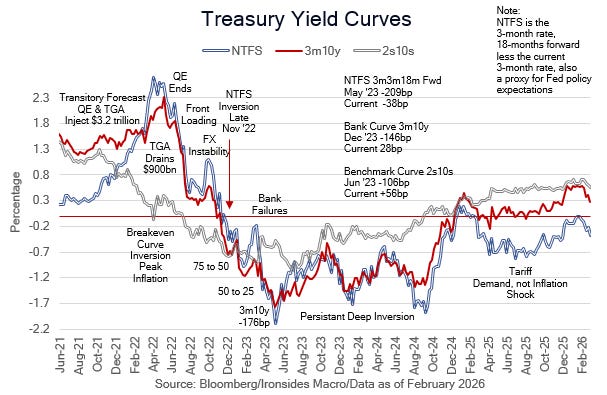
The performance of the Treasury market is raising similar concerns about the earnings, capex, growth and income outlooks. When 10s pushed above the 4.0% to 4.2% 4 1/2-month range at the beginning of earnings season in mid-January, it looked like our base case outlook was unfolding as expected. As earnings season winds down, 10s are below the bottom of the old range at 3.94%, led primarily by lower real rates. The 3m2y curve inversion is deepening, led by 2s at 3.375%, the lowest level since September ‘22 when the Fed’s third 75bp hike triggered yen intervention, the Truss UK government collapse, the US mortgage market plunge and their pandemic policy panic excessive asset purchases to turn into the biggest bet gone wrong in the history of capital markets (except for the ECB and BOJ). The unequivocal market message of the rally in 2s is that the Fed needs to resume reducing the policy rate.
Yet another component of a potential growth scare driven correction in equities could develop from the cracks on the periphery of the credit market. Two publicly traded business development companies (BDCs), one managed by KKR and the other Apollo, managers generally considered to be less aggressive lenders than Blue Owl, reduced their dividends and marked down loans that reduced their net asset values (NAVs). Additionally, the equity and mezzanine tranches (least default protection) of collateralized loan obligations (CLOs) are being marked down sharply as evidenced by plunging closed-end fund managers stock prices (ECC, OXLC, SPMC, CCIF). Importantly, loans are floating rate obligations, consequently, these assets are in the lower part of the ‘K-shaped’ economy struggling with a ~50bp restrictive monetary policy rate, while investment grade fixed rate borrowers continue to benefit from the Fed’s $6.5 trillion of long duration assets providing 50-75bp of accommodation. While non-financial credit has not grown faster than GDP this business cycle, the ratio is down 10% to 45% from mid-’20, consequently, we continue to view credit risk as more of an idiosyncratic rather than systemic, but the chickens are coming home to roost on the Fed’s excessive purchases of assets followed by aggressive rate hikes.
One of the old expressions we learned early in our career is bulls make money, bears make money, pigs and chickens get slaughtered. Some of the pigs are getting slaughtered. Many of the smartest credit traders and investors left investment banks for private credit firms after the GFC in large part due to poorly structured regulatory policy. There will be firms that thrive in this more difficult environment, but the Fed’s excessive accommodation caused malinvestment and some of the managers appeared to have been overly aggressive.
A crucial component of our expectation that earnings growth would broaden for core cyclicals, mid and small caps was reducing the policy rate to 3%, our estimate of the neutral rate, which would steepen the curve sufficiently to boost regional bank return on equity above 10% thereby reopening the credit channel to small businesses and small residential real estate developers. The resistance to additional rate cuts and bank regulatory relief from the leviathan Fed proponents, including Biden Fed Board appointments and a group of regional Fed Presidents, has stalled the rally in bank stocks, and is a risk to the ‘healthy broadening out’ outlook.
One final point before moving on, Chicago Fed President Goolsbee called Fed Chairman Powell a first ballot hall of famer for engineering a soft landing, or what he calls the golden path. We obviously disagree, but it brings to mind our explanation for why the economy did not go into recession despite the longest, and second deepest post-war inversion of the yield curve, exceptionally accommodative fiscal policy. As we’ve detailed, government spending growth was 11% in fiscal year (FY) ‘24, and transfer payments to individuals as a percentage of disposable income increased from a post-pandemic low of 17.3% in December ‘23 as the ‘emergency measures’ expired, back above 18% during the final year of the Biden Administration.
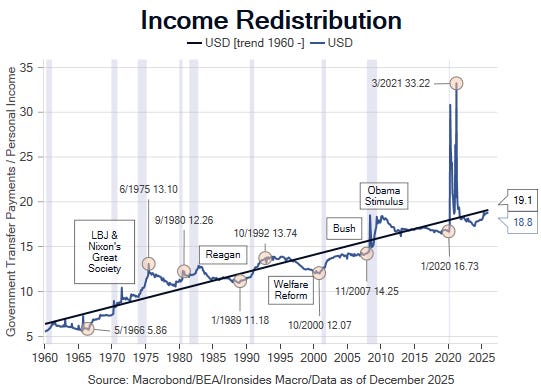
In short, the long and variable lags of the Fed’s poorly executed tightening cycle was more than offset by government spending 4% above its longer run median ratio to GDP/GDI. While transfer payments remain elevated, government spending growth through the first third of FY26 is 2%, down from 11% in FY24, and food stamp and Medicaid work requirements are likely to reduce the transfer payments fiscal policy channel as the year progresses. Fiscal stimulus from One Triple B is about to flow to a portion of the population, but the long and variable lags from the reduction in government spending growth appears to be negatively impacting the large part of the public dependent on the Biden fiscal boom.
Waiting for the Capex Boom
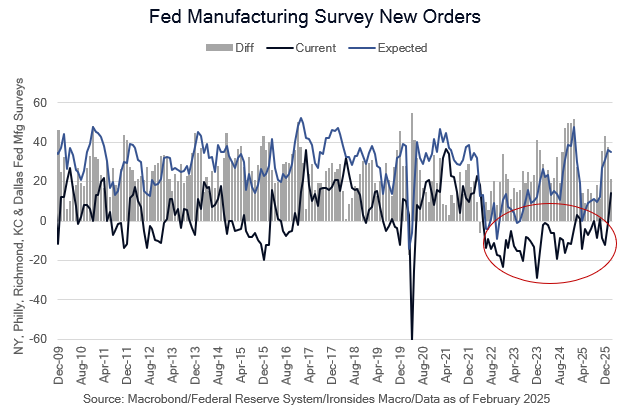
In a quiet week for economic data, we did receive the balance of the February regional Federal Reserve manufacturing and services sector surveys. The trajectory of expected orders lines up well with the equity market as a proxy for corporate confidence. Expected orders surged into the election, peaked at President Trump’s inauguration, plunged to zero following the Trump Tariff Shock, recovered to near the election-related peak in 4Q25 amidst monetary policy easing (rate cuts and the end of QT), before cooling in February. Meanwhile, the current orders portion of the survey have been contracting (with the exception of a couple of flat months) since the FOMC began the rate hike cycle in ‘22, until increasing in February to 14.1 from -1.2 in January. One month doesn’t make a trend, but the rebound followed a surprisingly strong ISM Manufacturing Survey in January.
Nevertheless, the Fed survey capex components fell in February back to zero and 6-month capex plans are not responding to the tax incentives in One Triple B as strongly as they did to the Tax Cuts & Jobs Act. The 6-month forward capex plans have been a useful indicator for core capital goods 3-months forward and S&P 500 capex 6-months forward.
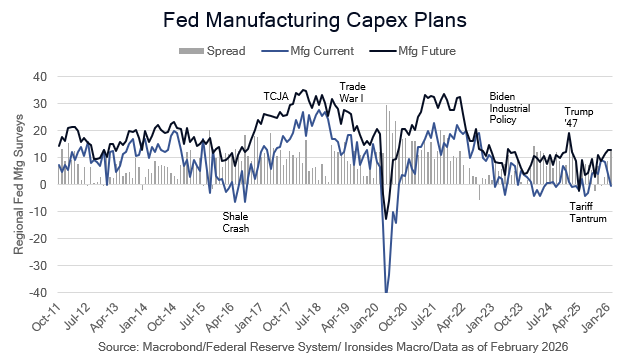
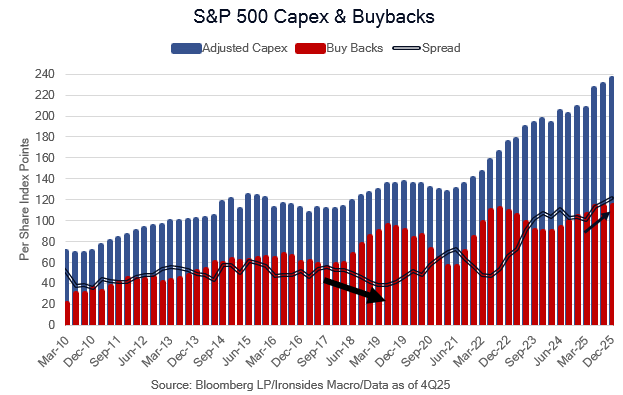
Current capital investment is even weaker for service providing industries. The weakness of these capex surveys, as well as the outsized contribution of the technology (29%) and communication services (46%) sectors to 16% S&P 500 capital investment growth, makes us suspicious that capex spending remains primarily driven by the AI infrastructure boom.
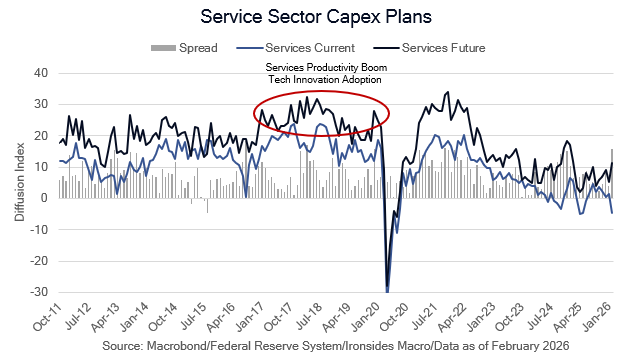
The soft capex surveys are another piece of evidence, like tepid core earnings growth and the bull flattening of the Treasury curve, that the ‘healthy broadening out’ has not yet begun. The economic case for a robust recovery in the manufacturing sector and a strong secular capex cycle hasn’t changed, but it would be encouraging to see some additional evidence it has begun.
Payroll Payback?
We begin our February employment week preview with some technical perspective. Any employment growth in the month of January is attributable to statistical smoothing, the median unseasonally adjusted decline in January since 2000 is -2.815 million, the largest unadjusted decline was 3.691 million, the smallest drop was 2.522 million and the standard deviation is 220,586. For the 10-year expansion prior to the pandemic the median January decline was 2.867 million, with median total employment over the period of 140.568 million (2.04%). Since the pandemic the median decline is 2.649 million with median employment of 156.043 million (1.70%). Clearly, there has been a statistically significant decline in seasonal firing after the holidays. Not surprisingly, there have been surprisingly strong reports 5 of the 6 years since the pandemic, we suspect the 4% increase in ecommerce market share as a percentage of total retail sales reduced seasonal hiring (November and December) and firing (January), and the BLS statistical smoothing hasn’t caught up to the structural change in seasonal hiring. Part of the initial overestimation has been reversed as additional responses led to negative revisions with the February report, a similar outcome seems probable on Friday.
“Second, initial payroll reports for January in each of the past few years have seen big revisions downward in subsequent reports a month or two later, and two other estimates of private-sector employment suggest something similar may be happening now. In contrast to the 172,000 gains reported by the Bureau of Labor statistics, as I noted, ADP reported that U.S. businesses created only 22,000 jobs last month. Another firm, Revelio, estimated only 3,000 new private-sector jobs in January. A less scientific survey of layoff announcements by the outplacement firm Challenger Gray and Christmas counted 108,000 layoff announcements last month, the most since October and the worst January for job cuts since 2009. Again, this conflict between private data sources and the initial jobs numbers leaves me concerned that the jobs report may contain more noise than signal.” Labor Market Data: Signal or Noise? Governor Waller
Because of the January data distortions, the delay in the January Job Openings & Labor Turnover Survey (JOLTS) under after the February Employment Situation Report, and a trip to NYC next week, we are not going to publish a separate preview note next week.
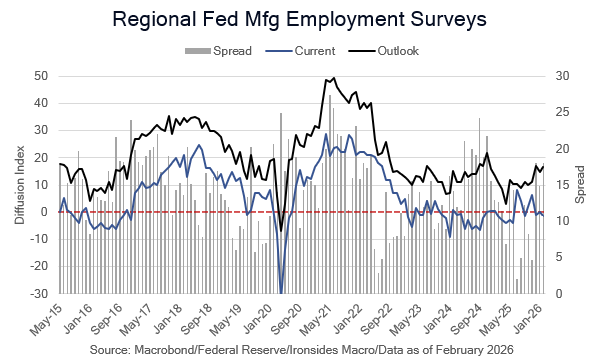
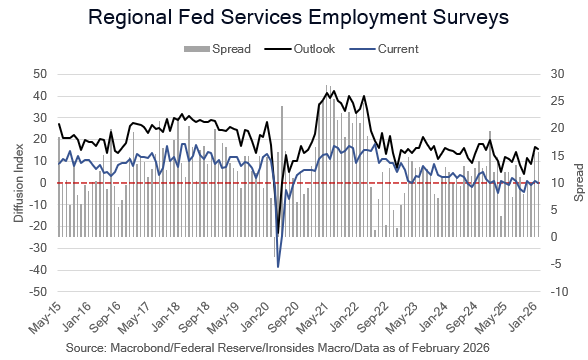
The Regional Federal Reserve Surveys showed no improvement in current hiring, but an improved outlook. The ISM surveys do not survey the outlook, just current hiring.
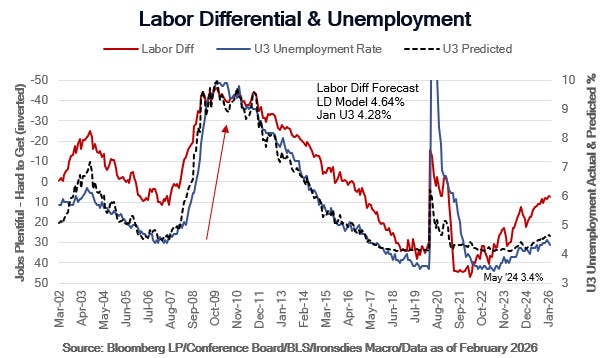
Another of the Bureau of Labor Statistics (BLS) issues since the pandemic was the size of the population during the Biden Administration’s open border policy. Typically, every January they make a population control adjustment with the help of the Census Bureau. The adjustments during the ‘22 and ‘23 peak immigration surge that by some accounts was greater than the prior population adjusted peak in 1890, were surprisingly small, and rather large in ‘24 after the flow slowed. This year’s adjustment was delayed a month due to the government shutdown, adding increased uncertainty to the household survey that determines the U3 unemployment, and U6 underemployment rates. The February Conference Board Labor Differential Survey has been significantly weaker than the BLS Household Survey for several months. Even with a marginal increase and modest upward revision to January, the predicted value for the U3 rate is 4.64% and 8.55% for the U6 rate, quite a distance from BLS’s January readings of 4.28% and 8.0%.
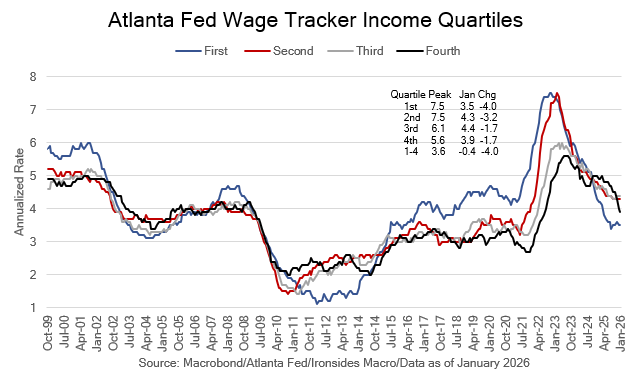
The one other interesting labor market report we received this week, although it was delayed, was the January Atlanta Fed Wage Tracker. The headline series, a 3-month average, cooled from 3.7% to 3.6%, and 4.2% in January ‘25. The most notable theme in the subcomponents was an extension of the sharp cooling of the highest income quartile wage growth to 3.9% from 4.0% in December, 4.5% in September and 4.9% in January ‘25. Meanwhile the lowest quartile wage growth was flat at 3.5%, a tenth above the cycle low of 3.4% in August. It seems reasonable to conclude reduced immigration is stabilizing wage growth for less skilled cohorts given a similar pattern for paid hourly and prime age workers, though service sector wages are still cooling. The drop in the highest quartile wage growth might be attributable to AI, but a more plausible explanation is large corporations struggling with weak demand due to the three adverse aggregate demand shocks and margin pressure due to tariffs, are using AI as an excuse to cut labor costs. Whatever the explanation, the Block management decision to cut half of their staff (4000 employees) in a move the company described as a bet on AI provides plenty of cover for company managements looking to cut costs. Excuse us for being skeptical of the explanation for layoffs from a company whose stock is at the bottom of a 5-year range, run by an individual who was less than forthright during the totalitarian speech suppression stage of the pandemic.
The Bloomberg consensus forecasts are 60,000 net payrolls, no changes to the 4.3% U3 rate, 34.3-hour work week, and 3.7% annual average hourly earnings rate. We will take the under on payrolls, mostly due to a negative revision to January, the under on average hourly earnings and the over on the U3 rate. We doubt it will be sufficiently weak to convince the Fed resistance to support a resumption of the cutting cycle in March, leaving small caps and regional banks in a difficult spot until Kevin Warsh is confirmed.
Nasty Narratives
We asked Grok what Robert Gordon has said about AI and the impact on productivity, here is the answer.
“Robert Gordon, the Northwestern University economist best known for his 2016 book The Rise and Fall of American Growth, has consistently expressed skeptical views on the potential of artificial intelligence (AI) to drive transformative productivity growth comparable to major historical innovations.
Gordon argues that the most profound productivity advances occurred during a “special century” roughly from 1870 to 1970, driven by groundbreaking inventions like electricity, the internal combustion engine, indoor plumbing, sanitation, and mass production. These (innovations) fundamentally reorganized daily life, work, and the economy, leading to rapid, broad-based gains in living standards and labor productivity.
In contrast, he views later digital innovations—including computers, the internet, smartphones, robots, and AI—as impressive but limited in scope. Their major productivity impacts on business largely played out between roughly 1980 and 2005, after which gains tapered off significantly. He sees AI and related technologies as evolutionary rather than revolutionary, unlikely to replicate the scale or speed of earlier breakthroughs.”
We met Gordon during our time at BlackRock amidst the slowest productivity growth for any post-war business cycle. We thought his outlook was overly pessimistic, perhaps as the son of an electrical engineering professor, we were more sympathetic to Brynjolfsson’s “The Second Machine Age”. During the last couple of years of the ‘10s business cycle, productivity returned to the post-war trend rate due to technology innovation adoption in the consumer services sector. That said, Gordon’s work on innovation during the special century, as well as Alexander Field’s “A Great Leap Foward”, that detailed the remarkable productivity gains during the Great Depression attributable to technology innovation in the ‘20s, with the Depression creating a fertile environment for technology innovation adoption, are underappreciated by current day technologists. In other words, curb your enthusiasm tech bros, indoor plumbing and sanitation were gamechangers for life expectancy and the quality of life, putting DoorDash, Visa or Salesforce out of business, if these companies don’t survive AI, will be soon forgotten.
Notwithstanding our longer run view, our decision two weeks ago to add exposure to the technology sector was at best early.
The Real MMT
(BN) FED’S MIRAN: OVER-REGULATION OF BANKS HARMS CREDIT CREATION
(BN) BOWMAN SAYS AGENCIES HAVE REACHED CONSENSUS ON CAPITAL PLAN
(BN) BOWMAN SAYS WORKING TO INTRODUCE BASEL PLAN BY END OF MARCH
No doubt the AI creative destruction theme is part of the poor performance of financials that slumped to the dubious distinction of the worst performing S&P 500 sector. In our view, the real issue for the decline is not AI creative destruction, instead it is the reason we marginally reduced our exposure two weeks ago, resistance to the Bessent/Warsh plan to reverse excessive state control over the sector and the privatization of the Fed’s balance sheet. For regional banks, the most important aspect of the three-step plan is reducing the policy rate to neutral (3%), which should steepen the 3m10y curve to ~1%, thereby boosting return on equity over 10%. In the near term, FOMC policy rate cuts driven by labor market weakness are a mixed blessing due to the negative implications for credit losses, however, the real MMT, the magic of maturity transformation (an upward sloping yield curve) is likely to overwhelm any credit losses given three years of minimal credit growth and a historically low loan to deposit ratio. In other words, if next week’s employment report triggers a growth scare correction, we will be a buyer of banks into the weakness.
The largest banks are even less exposed to credit risk, and they are dependent on stage two of the process, regulatory relief. Although the stocks didn’t respond, Fed Vice Chair for Supervision was on Capitol Hill this week detailing the regulatory process. In short, they are on track and the process will gain focus during the Warsh hearings next month and will accelerate when he moves into the Eccles Building. Another couple of points lower, the S&P Regional Bank Index (KRE) will look exceptionally attractive, and we will be tempted to reverse our risk reduction initiated two weeks ago. As we are drafting this note the S&P 500 Financials Index is down 2.4% and the Regional Bank Index is down 4.8%, these declines are unwarranted by the outlook. We are comfortably overweight the sector and are more likely to add than reduce risk further.
Midterm Corrections
A year ago, just prior to a trip to NYC, the growth outlook was deteriorating as is the case now, leading us to publish Cleaning Up the Industrial Policy Mess, where we called for an equity market correction. In addition to the deteriorating equity market outlook, during the last 5 midterm years the equity market suffered significant pullbacks. Finally, there is a pattern of the markets testing new Fed Chairs with the granddaddy of those episodes the Crash of ‘87. With all this precedent it is tempting to make a significant correction forecast, and while it’s never different this time, it is rarely the same as the last time.
First, a year ago the transition from industrial policy that Treasury Secretary Bessent called a detox from our addiction to government spending, was just beginning, now it is winding down. Second, the 2022, 2018, 2014, 2010 and 2006 midterm corrections were primarily attributable to monetary policy tightening, with the deep 2010 correction exacerbated by the enactment of poorly constructed healthcare and financial sector restructuring legislation. Today, although monetary policy is tightening marginally, easing is likely to begin again shortly, and the administration’s policies adverse aggregate demand effects are dissipating. Finally, the new Fed Chairman hasn’t even begun his Senate hearings, and while there may well be a test later in the year, it is too early for the Fed Chair test.
As tempting it is to fly to NYC, and deliver a bearish message on television, and at a conference with a preponderance of media talking heads with a bullish bias, we are not as bearish as we were a year ago. We have a 10% cash position in our equity recommended allocation, we’ve been recommending hanging on to your cash and are not changing our somewhat cautious view. If we get a correction in the near term, it will not be our 2026 outlook base case scenario of a higher real rate shock, instead it will be a growth scare concentrated into economically sensitive cyclical sectors. Although investors are curbing their earnings and growth enthusiasm, we remain confident capital investment will broaden beyond AI infrastructure later this year.
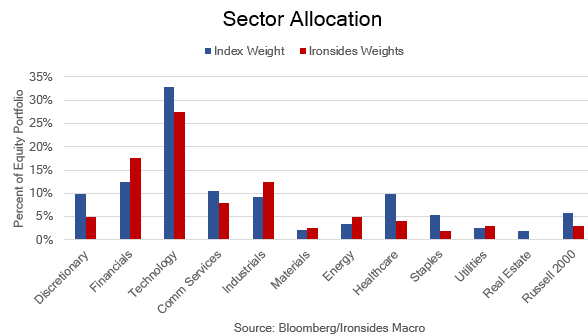
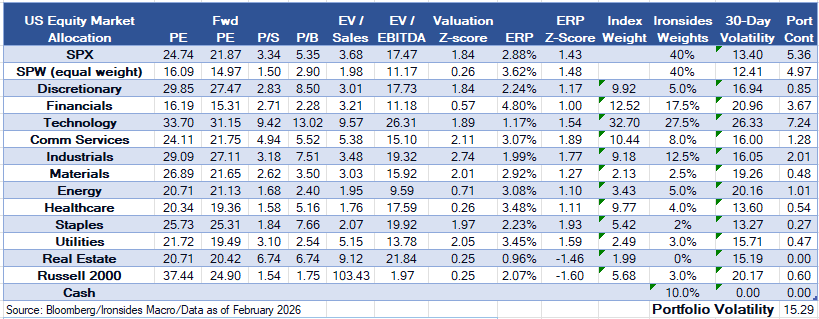
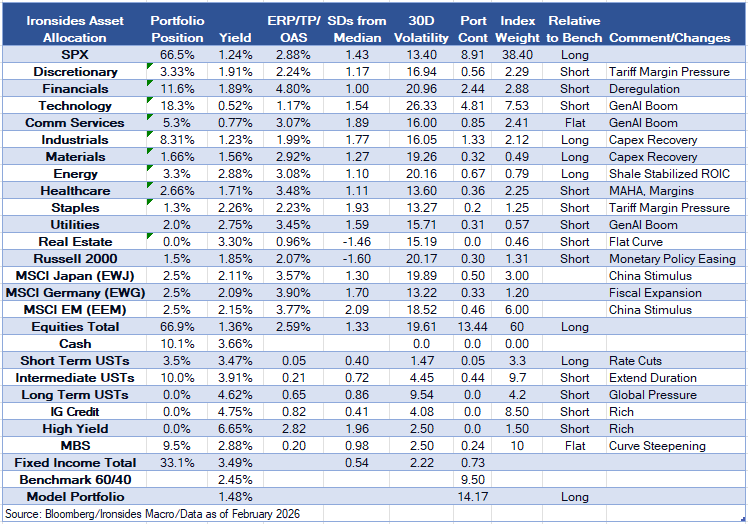
Sector and Asset Allocation Tables Explained:
The US Equity Market Allocation table is our recommendations for a US equity investor, a similar approach to when we were the Head of Barclays US Equity Portfolio Strategy. The first six columns are valuation metrics, the seven is a Z-Score summary of the metrics relative to each sector’s valuation range since S&P introduced each sector (1990 for all but Real Estate). A reading of 1 implies the sector is 1 standard deviation above its historical median. The equity risk premium (ERP) column, also known as the Fed Model, is the forward (expected) earnings yield less the real 10-year yield (TIPS). Index weights are the S&P 500 with the exception of the Russell 200 small cap index, that is based on the market cap of the Russell 2000 relative to the Russell 3000. The final three columns are the Ironsides recommended weight, the 30-day volatility of the sector and portfolio contribution of our recommended weights to the risk (volatility) of the portfolio. Importantly, this approach does not integrate cross correlation of the sectors.
The asset allocation table benchmark is a 60/40 (stocks/bonds) portfolio, under the assumption that the investor is investing US dollars. We begin with our recommended weights, add the yield, the third columns are valuation metrics. ERP is the equity risk premium. TP is the term premium for Treasuries using the Adrian Crump & Moench model from Bloomberg. OAS is the option adjusted spread (early call risk) for fixed income securities. ‘SD’s’ from the median is a Z-Score approach to the valuation metrics, positive readings imply the asset is expensive, negative readings imply the asset’s valuation is below its longer-run median. The sixth column is the assets contribution to the risk of the portfolio, its volatility multiplied by the recommended weight of the asset. The index weights for equities use the same approach as the equity only portfolio, benchmarked to the MSCI World Index, adjusted for the 60/40 benchmark. Fixed income weights are based on the Bloomberg US Aggregate Index, adjusted for the 60/40 benchmark. The final two columns are self-explanatory.
Barry C. Knapp
Managing Partner
Director of Research
Ironsides Macroeconomics LLC
908-821-7584
bcknapp@ironsidesmacro.com
https://www.linkedin.com/in/barry-c-knapp/
Follow us on X @barryknapp