


Earnings Season – 3 Themes to Watch
Earnings Season – 3 Themes to Watch
Revenue growth, capital spending and bank profitability

Please consider becoming a paid subscriber, we expect to transition the notes to a free summary and full note for paid subscribers format in the relatively near future.
Micro to Macro: What can earnings season tell us about economic growth
Back in the days when fundamental equity investors were dismissive of modern portfolio theory and risk management – recall Peter Lynch of Fidelity Magellan Fund fame describing ‘deworsesification’ – quarterly GDP reports were of little interest to equity investors. Monthly employment reports were another matter, undoubtedly due to the Fed’s dual mandate and multi-decade Treasury bull market. In the post-global financial crisis ‘new normal’, the GDP report and growth generally have developed into a focus of all market participants despite the well documented flaws in the measurement of output and the unstable relationship of the expenditure method of estimating growth (GDP) to what really matters to equity and credit investors; revenues and earnings. GDP is not particularly efficacious in measuring savings and investment either, factors integral into estimates of r*, also known as the natural rate of interest, and therefore GDP is not all that useful to fixed income investors either.
The Bureau of Economic Analysis (BEA) has two alternate methods of estimating growth, gross domestic income¹ and gross output², both are more representative of business activity and profitability than the expenditure method of estimating growth - GDP. Gross income measures household and corporate income, while gross output includes intermediate or business-to-business transactions. Unfortunately, because both measures are not available after well after the advanced estimate of GDP and corporate results, they have no real forecasting value other than long term analysis of the drivers of the business cycle. Therefore, when we analyze corporate results much of our focus is micro to macro, which is using corporate results to determine macroeconomic trends.
¹ “The Income- and Expenditure-Side Estimates of U.S. Output Growth”, Jeremy J. Nalewaik https://www.brookings.edu/wp-content/uploads/2010/03/2010a_bpea_nalewaik.pdf
²“Linking Austrian and Keynesian Economics: A Variation on a Theme”’ Mark Skousen, Chapman University http://journal.apee.org/index.php?title=Parte7_Journal_of_Private_Enterprise_vol_30_no_4.pdf
This brings us to the first theme to watch during earnings season, revenue growth.
Theme One - Focus on Sales Rather Than Earnings
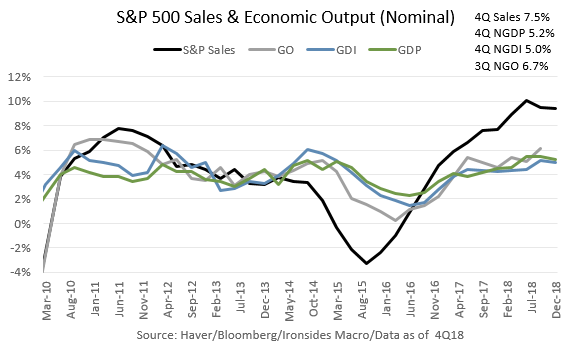
Our logic in creating this less than elegant chart is to make a couple of important points. First, sales growth – last year over the prior year - during the ‘new normal’ period from 2010-2013 slipped below 5% as did the three measures of nominal – not adjusted for inflation – measures of output. Our second observation is that nominal gross output got perilously close to contracting in 4Q15 at 0.24%, gross income slipped to 1.44% in 2Q16, NGDP’s low was 2.3% in 2Q16 while sales growth contracted 3.24% in 3Q15 during the ‘earnings recession’. In other words, the corporate sector came perilously close to dragging the economy into a recession during the oil and Chinese heavy industry slumps from mid-2014 to early 2016. The final point is that beginning in 2017, corporate sales growth and the measures of output reached ‘escape velocity’ over 5%, a level that creates positive corporate operating leverage. We suspect revenue growth will remain above 5% and will be watching the economically sensitive cyclical sectors, particularly industrials, consumer discretionary and financials. Thursday’s report from industrial distributor Fastenal was encouraging for the industrials sector and was consistent with the theme of last week’s note that the struggles of the Chinese export sector is less impactful than their 2015 heavy industry hard landing.
One aside, in our view a major contributor to the ‘new normal’ was a series of policy uncertainty shocks that monetary policy temporarily ameliorated only to create additional volatility when the asset purchase programs reached their expiration dates. In 2010, policy uncertainty measures spiked following the passage of Affordable Care and Dodd Frank, as corporates and investors grew concerned about increased government intervention in two of the largest economic sectors. In 2011, the debt ceiling standoff, sovereign credit rating downgrade and budget deal unfolded as QE2 expired leading to a massive confidence shock. In 2012, it was typical Presidential election year uncertainty was exacerbated by the end of ‘Operation Twist.’ Every business cycle since WWII has been subject to a monetary policy normalization related equity market correction; this cycle has had eight such volatility shocks, the majority were attributable to unwinding unconventional policy. With the Fed pause so ingrained in investor psychology due in part to superfluous communication, were they to restart the tightening cycle later this year another similar policy normalization related shock would likely develop.

Theme Two - Capital Investment and Productivity
This brings us to our second earnings season theme, determining whether the boom in capital investment in intellectual property products (IPP) – primarily software – continued in 1Q19. As we covered in our note two weeks ago, trade policy uncertainty and the reduction of demand for fixed income from the ECB, BOJ and Fed that created a transitory hit to business confidence. Part of the slowing growth narrative was that the tax bill was Keynesian demand stimulus that had already faded as equipment spending faded in 2H18. Our view remains that there was little benefit from the tax bill for equipment spending, however, IPP was a major beneficiary. Because there is no monthly series for IPP, in fact, the BEA considered software, equipment as an expense until 2013; the weakness in 4Q18 core capital goods orders lead to an incorrect assessment of the strength in capital spending as software and R&D continued were exceptionally strong. This is no trivial matter; we are convinced the tightening of the labor market has driven businesses to substitute capital for labor and the improvement in productivity growth and resiliency of profit margins in 2018³ was the result. A lack of an inflationary impulse is further evidence of this dynamic. S&P 500 capex increased 17.3% in 4Q18; expectations are for a still strong 11.7% increase in 1Q19. Sure buybacks were strong, but so was capital investment.
³https://ironsidesmacro.substack.com/p/its-a-profit-margin-game

Theme Three - Bank Profitability and Lending to the Private Sector
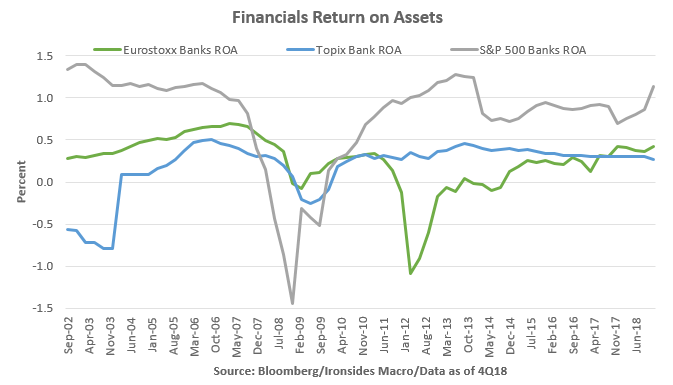
Our third theme, and one we will get the most information on early in the process, is whether bank profitability will remain above banks cost of capital. When ECB President Draghi said on Thursday that European banks were as profitable as Japanese banks, he should have said unprofitable. Domestic commercial bank credit growth improved from a 3% year-on-year rate at the end of 4Q18 to 4.2% at the end of 1Q19. Commercial & industrial lending remained robust at 10.6%, just above the 4Q18 level of 10.5%. Loan growth was stable at 5.2%. Most of the acceleration in credit was attributable to a strong increase in securities to 5.3% from 1.6%. The increase in securities holdings is an unwelcome development given the improvement from lower spread government securities to private sector loans that occurred throughout 2018. Still, in this quarter both loans and securities grew so there did not appear to be a crowding out effect, though we are concerned the strong securities growth is evidence of the deleterious effects of overly accommodative monetary policy. Wells Fargo results on Friday morning were encouraging, despite the regulatory asset cap, return on assets of 1.26% are well above 1.09% in 1Q18 boosting return on equity of 12.7% from 10.6%. Given the inability to grow assets, improved profitability is consistent with our bullish thesis for the sector. Banks rallied sharply after 4Q18 results due to improved profitability, the March correction following the March FOMC meeting and the yield curve flattening rally was a buying opportunity for the banks. We expect ROA and ROE to at least hold 4Q18 levels.
Bonus Theme - No Evidence of TCJA Driven Deleveraging
One final issue to consider, one of the corporate tax expenditures (deductions) eliminated in the Tax Cuts & Jobs Act (TCJA) was interest expense above 30% of EBITDA until 2021 then 30% of EBIT thereafter. Net debt to EBITDA and interest expense to EBIT and EBITDA increased marginally in 2018 though all three measures remain near multi-decade lows well below the 30% threshold on either measure. Still, the aggregate level of nonfinancial corporate sector debt has increased steadily this cycle and some have noted similarities of leveraged loans to subprime RMBS last cycle. We continue to believe leveraged loans are not systemic given that the level of nonfinancial corporate debt to GDP near 50% is less than half of the household sector in the mid ‘00s. The holders of the debt and issuers are significantly different to make the comparison spurious in our view. Additionally the banking system does not appear to be a likely conduit for financial contagion. Still, there was no evidence that TCJA encouraged debt reduction in 2018 so we will be watching to for evidence of deleveraging.

The Mix Matters as Much as the Level
One of our core themes for 2018 was that there would be a mix shift in growth from consumption (PCE) to investment. From mid-2009 when the Great Recession ended until mid-2014 when oil prices collapsed, consumption averaged 1.9% far below the post-WWII average of 3.4%. Since mid-2014, PCE has averaged 3%. Because consumption had normalized, and given that the changes to the individual tax code were primarily wealth transfers, we expected only a transitory increase in 2018. Because the US had consistently underinvested in its capital stock for decades during the period of rapid globalization, we expected TCJA to be a catalyst for a capital-spending boom like the ‘60s or ‘90s. Last year’s stronger productivity growth, exceptionally strong revenue growth, rising corporate margins and less not more inflation were all indicative that the supply-side effects Fed Chairman Powell hopes will develop are off to a very good start. The mix in corporate results matters as well, revenue growth in capital spending geared sectors and industries, and improved profitability in the banking system due to increased lending to the private sector, imply the supply-side corporate tax reform and deregulatory policies still have traction.
Final Thoughts: Politicizing the Fed & Reforming Capitalism
A couple of final thoughts on issues that received considerable attention this week that were mischaracterized in our view. For all the breathless reporting in the media about politicizing the Fed with the latest nominations, they have CEA Director Kudlow’s supply side economic views written all over them. In our view, there is homogeneity of New Keynesian economists at Board and any supply siders or classic economic liberals, could move the Committee away from interventionism generally and reliance on the Phillips Curve model as a the key monetary policy operating principal specifically. In other words the debate is about economic thought, an old fashioned Keynes vs. Hayek battle.
The second issue we think is worth commenting on is idea that capitalism needs reforming due to increased wage inequality in the US over the last three decades. For anyone sympathetic to this line of thought, we strongly suggest reading Charles Goodhart’s and Manoj Pradhan’s “Demographics will reverse three multi-decade global trends.”⁴ The following passage is from the abstract.
Between the 1980s and the 2000s, the largest ever positive labour supply shock occurred, resulting from demographic trends and from the inclusion of China and eastern Europe into the World Trade Organization. This led to a shift in manufacturing to Asia, especially China; a stagnation in real wages; a collapse in the power of private sector trade unions; increasing inequality within countries, but less inequality between countries; deflationary pressures; and falling interest rates. This shock is now reversing. As the world ages, real interest rates will rise, inflation and wage growth will pick up and inequality will fall.
⁴https://www.bis.org/publ/work656.htm
In other words, markets not policy makers, are the solution to wage inequality in the developed world and the invisible hand as well as misguided policy from China started the reversion process a decade ago.
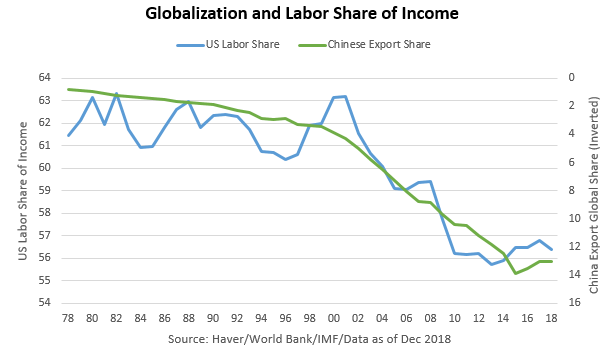
Please Note: Chinese export share are inverted to make the chart easier to interpret.
Barry C. Knapp
Managing Partner
Ironsides Macroeconomics LLC
908-821-7584
https://www.linkedin.com/in/barry-c-knapp/
@barryknapp
This institutional communication has been prepared by Ironsides Macroeconomics LLC (“Ironsides Macroeconomics”) for your informational purposes only. This material is for illustration and discussion purposes only and are not intended to be, nor should they be construed as financial, legal, tax or investment advice and do not constitute an opinion or recommendation by Ironsides Macroeconomics. You should consult appropriate advisors concerning such matters. This material presents information through the date indicated, is only a guide to the author’s current expectations and is subject to revision by the author, though the author is under no obligation to do so. This material may contain commentary on: broad-based indices; economic, political, or market conditions; particular types of securities; and/or technical analysis concerning the demand and supply for a sector, index or industry based on trading volume and price. The views expressed herein are solely those of the author. This material should not be construed as a recommendation, or advice or an offer or solicitation with respect to the purchase or sale of any investment. The information in this report is not intended to provide a basis on which you could make an investment decision on any particular security or its issuer. This material is for sophisticated investors only. This document is intended for the recipient only and is not for distribution to anyone else or to the general public.
Certain information has been provided by and/or is based on third party sources and, although such information is believed to be reliable, no representation is made is made with respect to the accuracy, completeness or timeliness of such information. This information may be subject to change without notice. Ironsides Macroeconomics undertakes no obligation to maintain or update this material based on subsequent information and events or to provide you with any additional or supplemental information or any update to or correction of the information contained herein. Ironsides Macroeconomics, its officers, employees, affiliates and partners shall not be liable to any person in any way whatsoever for any losses, costs, or claims for your reliance on this material. Nothing herein is, or shall be relied on as, a promise or representation as to future performance. PAST PERFORMANCE IS NOT INDICATIVE OF FUTURE RESULTS.
Opinions expressed in this material may differ or be contrary to opinions expressed, or actions taken, by Ironsides Macroeconomics or its affiliates, or their respective officers, directors, or employees. In addition, any opinions and assumptions expressed herein are made as of the date of this communication and are subject to change and/or withdrawal without notice. Ironsides Macroeconomics or its affiliates may have positions in financial instruments mentioned, may have acquired such positions at prices no longer available, and may have interests different from or adverse to your interests or inconsistent with the advice herein. Ironsides Macroeconomics or its affiliates may advise issuers of financial instruments mentioned. No liability is accepted by Ironsides Macroeconomics, its officers, employees, affiliates or partners for any losses that may arise from any use of the information contained herein.
Any financial instruments mentioned herein are speculative in nature and may involve risk to principal and interest. Any prices or levels shown are either historical or purely indicative. This material does not take into account the particular investment objectives or financial circumstances, objectives or needs of any specific investor, and are not intended as recommendations of particular securities, investment products, or other financial products or strategies to particular clients. Securities, investment products, other financial products or strategies discussed herein may not be suitable for all investors. The recipient of this report must make its own independent decisions regarding any securities, investment products or other financial products mentioned herein.
The material should not be provided to any person in a jurisdiction where its provision or use would be contrary to local laws, rules or regulations. This material is not to be reproduced or redistributed to any other person or published in whole or in part for any purpose absent the written consent of Ironsides Macroeconomics.
© 2019 Ironsides Macroeconomics LLC.