


China: Malinvestment Central
China: Malinvestment Central
A second global shock originating in China, this one from the export sector

This week we introduced an audio summary of our weekly for paid subscribers and published a podcast on https://ironsidesmacro.substack.com for everyone. Please consider becoming a paid subscriber, we expect to transition the notes to a free summary and full note for paid subscribers format in the relatively near future.
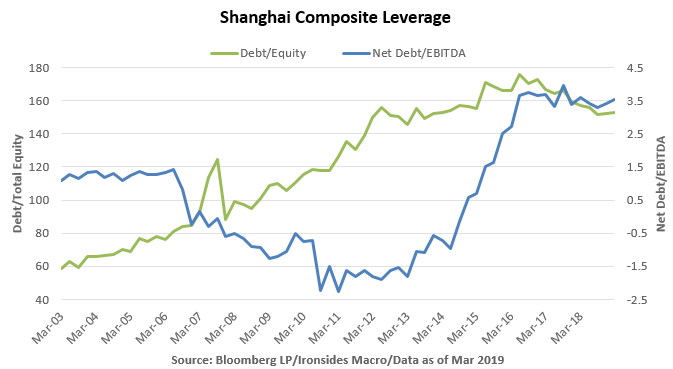
Ahead of next week’s March Chinese data, and because one area of pushback on our bullish outlook is weakening global growth, we are going to explain why we believe the near term implications of a second global shock originating in China is significantly less than the 2014-2016 heavy industry hard landing. As our long time readers know, our macroeconomic views lean towards what F.E. Hayek called the spontaneous economic order and we agree that central planning is ‘the fatal conceit.’ Having had a front row seat for the global financial crisis we have read everything we could find on the ‘real effects of debt’ and view China’s post-crisis debt binge as an ongoing source of global risk.
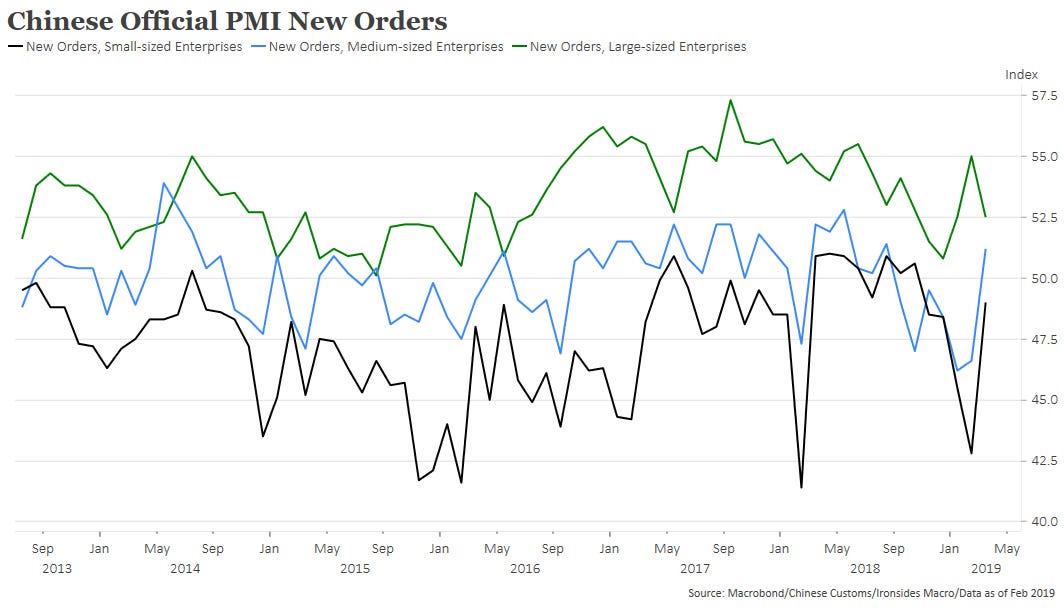
In this note, we are going to concentrate on the global implications of rolling malinvestment busts in China attributable to the fatal conceit of state directed capital allocation. The bottom line is that while they are going through their second major investment bust in the last five years, global spillovers from the sharp drop in the export sector are unlikely to be nearly as serious as the 2014-2016 hard landing in heavy industry investment. The most recent PMI report, corporate sector sales forecasts and stock prices offer some evidence that the policy response to the weak export sector, providing incentives for small and medium private sector companies (SMEs), is gaining traction. Additionally a trade deal could accelerate economic rebalancing by weakening protection for heavy industry state owned enterprises and the export sector and strengthening intellectual property protection for domestic innovators. The debt issue has not been resolved, though it appears that they have additional capacity to internally cover their existing obligations and even expand leverage incrementally, at least for the intermediate term. There is political stability risk to reducing the economic role of state owned enterprises, but they took this step in the ‘90s and appear to recognize the importance now.
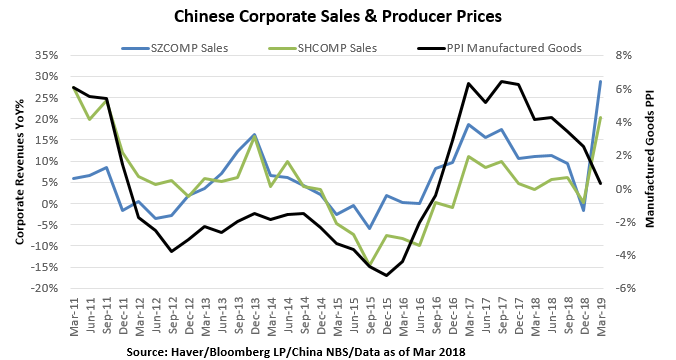
While skepticism of consensus forecasts for revenue growth for Chinese companies is understandable, if sales do turn up the effect of the trade shock will have been much smaller than the heavy industry hard landing.
The Heavy Industry Investment Bust 2014-2016
We want to begin by stating clearly that any description of global growth deserves an asterisk given how dubious we consider Chinese GDP. We once heard it described by a China analyst as aspirational and a policy objective. One recent report published by Brookings titled “A forensic examination of China’s national accounts”¹ made a very plausible case that local government accounting of investment was inflated due to growth incentives. The overestimation of investment since 2008 likely overestimated the national GDP by 1.7% annually. We view their findings consistent with our heavy industry hard landing characterization of the drop in Shanghai Composite sales and earnings growth from 10% in early 2014 to -20% by early 2016 and similar decline in ordinary imports, as well as manufacturing PPI deflation of -6%. An IMF working paper in March 2016 titled ‘China’s Import Slowdown: Spillovers, Spillins, and Spillbacks’² concluded that:
“A hypothetical drop of China’s imports by 10 percent below the baseline in 2016 and 2017 would lead to a loss of about 1.2 percent GDP of export revenue in 2016 for all countries, which with network effects may increase to 2.0 percent of GDP in 2017 before abating gradually by 2020 to about 0.2 percent of GDP in 2020.”
¹https://www.brookings.edu/bpea-articles/a-forensic-examination-of-chinas-national-accounts/
²https://www.imf.org/external/pubs/ft/wp/2016/wp1651.pdf
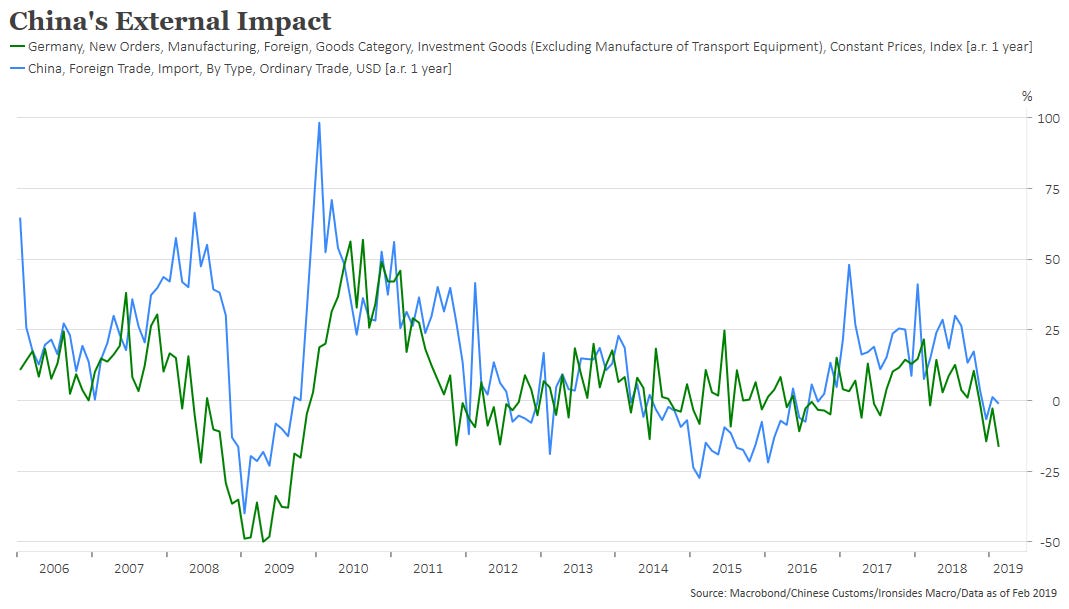
Of course, by the time the IMF report went to print, the worst of the storm had passed and ordinary imports recovered to 21.5% in 2017 and 18.2% in 2018.
The IMF report goes on to point out the following:
“The impact on individual regions would depend on their economic size and relative position in China’s trade network. Asia and Pacific will be affected the most, because of their high exposure to trade with China, followed by the Middle East and Central Asia. The impact on sub-Saharan Africa would be also noticeable because of its small economic size and growing trade with China. The spillovers on Europe, including the euro area, will be moderate relative to its economic size; and spillovers on the Western Hemisphere, including the United States, would be marginal.”
This was the period of the ‘fragile five’ emerging economies with large external debt, the 75% drop in oil prices, 25% increase in the trade weighted dollar and S&P 500 earnings recession. The Chinese policy response appears to have led to a boom in the export sector just a point when the US political system was responding the three decades of wage disinflation partially attributable to China’s global export share gains. We would characterize policymaker efforts to cut excess heavy industry capacity as successful in the achieving the Chinese goal of stability, but by impairing the process of creative destruction, China continues to misallocate resources risking further productivity gains.
The Second Shock: The Export Sector
In Charles Mann’s fascinating book, “1493”, he characterizes the mercantilist policies of the Ming dynasty as central to their 17th century collapse. The ‘Galleon trade’ that imported silver from the Americas, initially stabilized a chaotic monetary regime, but later led to exploitation of the environment and misallocation of resources. Ultimately, the world’s largest economy found itself overly indebted and unable to pay for defense against the Manchus from the north. While it is certainly possible the central committee has a different interpretation of this period, they must know that the history of massive current account surpluses is not a happy one. Recently history also points to the risk of promoting exports using exchange rate policy. The abstract to a 2011 NBER paper titled “When Fast Growing Economies Slow Down: International Evidence and Implications for China”³ reads:
Using international data starting in 1957, we construct a sample of cases where fast-growing economies slow down. The evidence suggests that rapidly growing economies slow down significantly, in the sense that the growth rate downshifts by at least 2 percentage points, when their per capita incomes reach around $17,000 US in year-2005 constant international prices, a level that China should achieve by or soon after 2015. Among our more provocative findings is that growth slowdowns are more likely in countries that maintain undervalued real exchange rates.
Environmental policy and a trade deal that includes currency policy would indicate they understand the history Charles Mann and Barry Eichengreen, et al described.
³https://www.nber.org/papers/w16919.pdf
The good news is that market forces are diminishing China’s dependence on exports; unit labor cost equalization, rising transportation and energy costs, and greater supply chain and exchange rate risks have moved global manufacturing towards a model of producing as logistically close to final demand as possible. In other words, the model of capitalizing on inexpensive labor in the emerging world and China in particular, to sell products all over the globe reached its peak at the end of the last business cycle ten years ago. One example is the growth rate of China, South Korea, Taiwan and Japan’s exports. In the ‘00s expansion their export growth averaged 14.1%, this cycle the average annual growth rate is 6.5% roughly the same as nominal GDP implying that globalization is no longer expanding.
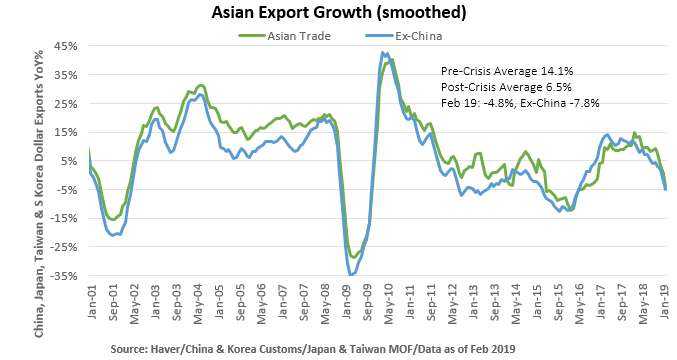
This leads to the question about what happened since November. Next week Taiwan and China will release March trade data, the first country to release each month is South Korea and the 8.2% year-on-year drop, while not as bad as the holiday-shortened month of February’s 11.4% decline, was worse than expected and hardly encouraging. Nevertheless, survey data from purchasing manager surveys (PMIs) and stock market performance point to a recovery. While some readers may scoff at using stock prices as an indicator, Asian and German equities began falling in May 2018 led by export sensitive sectors some 7 months in advance of US tariff deadline threats and 6 months prior to the collapse in trade growth. It seems probable some of the strength in global trade in 2018 was stockpiling ahead of the tariff threats, when the deadline passed and negotiations began, orders evaporated and may not be recovering as buyers anticipate that a deal will eliminate existing tariffs. We suspect the drop in Chinese imports, Asian exports and German foreign capital goods orders was exacerbated by the second order effect from the weaker business confidence. Given the relationship between stock prices and business confidence, we expect the rebound in Asian PMIs in March to spread to Europe in 2Q. Still, the trade shock is a warning sign to China, South Korea, Japan and Germany that export subsidies paid for with consumption taxes and currency policy is a misallocation of resources.
Fallout from the Trade Shock in the US
From the US perspective we won’t belabor the fact that we run a large current account deficit therefore a weakening of global trade is additive to US growth as the Bureau of Economic Analysis accounts for it. We will make two brief points about why we think the trade deficit is overstated. First, consider an Apple iPhone assembled in China currently accounted for as an import at the cost of the phone. The real value of profits accrue primarily to the intellectual property owners and shareholders of Apple, while Foxconn derives far less profit from the assembly. This brings us to the second point, while the US had a higher corporate tax rate and worldwide taxation system there were considerable incentives to book expenses in the US and profits overseas using transfer price accounting. Intangible investment, advanced technology products, and drug patents are examples where there is little transparency in product pricing making them particularly useful in tax minimization strategies. This dynamic largely explains why the technology and healthcare sectors’ 2017 effective tax rates were already at or below the 2018 21% corporate tax rate. It is important to note that during the 25% increase in the trade-weighted dollar from 2014-2016 US exporters saw their revenues drop only by an amount consistent with no real loss of competitiveness. Given the much smaller increase in the dollar during the second China shock, the effects evident this earnings season are likely to be negligible.
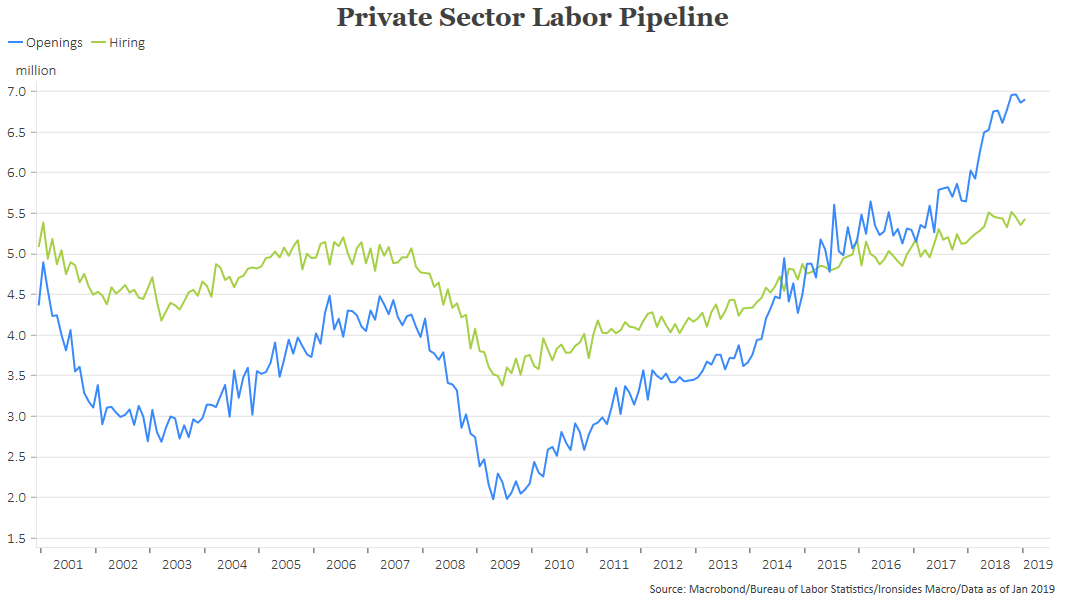
Still, we are not dismissive of the confidence channel effects of the global trade shock. As we noted last week⁴, the outlook for capital spending plans and labor market dynamism, measures we consider critical to the length of the business cycle due to their effect on productivity growth, deteriorated due to the late 2018 trade shock and central bank liquidity driven equity market crash. Capital spending plans recovered in March, and the broadest measure of the March employment report, the aggregate hours index points to a recovery in dynamism. The report was not all positive, labor force participation and the employment to population rates both fell, the median duration to find a job increased and job leavers declined all of which imply a less dynamic labor market. Still, the nonsupervisory average hourly earnings series increased 0.3% on the month and 3.3% annualized and job growth in the two sectors with the greatest job openings to hiring gap – professional & business services and healthcare – saw decent growth. Two other sectors with positive gaps leveraged to global trade – transportation & warehousing and manufacturing – had more tepid net job growth. So, while this month’s report contained some of the lingering effects of the confidence shock there were sufficient positive elements to keep us on track for a recovery in worker reallocation - the quarterly sum of hiring and separations.
⁴https://ironsidesmacro.substack.com/p/the-transitory-growth-scare
On balance last week’s data - February retail sales and durable goods, March auto sales, ISM surveys and the employment report as well as weekly jobless claims and mortgage applications - increased our confidence that the ‘transitory growth scare’ has passed. The major question for 2Q domestic macroeconomic data is the strength of capital deepening, labor dynamism and the outlook for productivity. Earnings season begins in earnest next Friday, we will be watching the technology sector closely for evidence the strong 2018 technology spending will continue. If intellectual property products investment and worker reallocation do not decelerate much from the torrid 2018 pace, there is no reason to think we can’t grow above potential without an increase in the level or volatility of inflation. Productivity gains are likely in the pipeline, stay long US cyclical stocks, short real (TIPS) longer duration Treasuries, and overweight emerging market equities.
Barry C. Knapp
Managing Partner
Ironsides Macroeconomics LLC
908-821-7584
https://www.linkedin.com/in/barry-c-knapp/
@barryknapp
This institutional communication has been prepared by Ironsides Macroeconomics LLC (“Ironsides Macroeconomics”) for your informational purposes only. This material is for illustration and discussion purposes only and are not intended to be, nor should they be construed as financial, legal, tax or investment advice and do not constitute an opinion or recommendation by Ironsides Macroeconomics. You should consult appropriate advisors concerning such matters. This material presents information through the date indicated, is only a guide to the author’s current expectations and is subject to revision by the author, though the author is under no obligation to do so. This material may contain commentary on: broad-based indices; economic, political, or market conditions; particular types of securities; and/or technical analysis concerning the demand and supply for a sector, index or industry based on trading volume and price. The views expressed herein are solely those of the author. This material should not be construed as a recommendation, or advice or an offer or solicitation with respect to the purchase or sale of any investment. The information in this report is not intended to provide a basis on which you could make an investment decision on any particular security or its issuer. This material is for sophisticated investors only. This document is intended for the recipient only and is not for distribution to anyone else or to the general public.
Certain information has been provided by and/or is based on third party sources and, although such information is believed to be reliable, no representation is made is made with respect to the accuracy, completeness or timeliness of such information. This information may be subject to change without notice. Ironsides Macroeconomics undertakes no obligation to maintain or update this material based on subsequent information and events or to provide you with any additional or supplemental information or any update to or correction of the information contained herein. Ironsides Macroeconomics, its officers, employees, affiliates and partners shall not be liable to any person in any way whatsoever for any losses, costs, or claims for your reliance on this material. Nothing herein is, or shall be relied on as, a promise or representation as to future performance. PAST PERFORMANCE IS NOT INDICATIVE OF FUTURE RESULTS.
Opinions expressed in this material may differ or be contrary to opinions expressed, or actions taken, by Ironsides Macroeconomics or its affiliates, or their respective officers, directors, or employees. In addition, any opinions and assumptions expressed herein are made as of the date of this communication and are subject to change and/or withdrawal without notice. Ironsides Macroeconomics or its affiliates may have positions in financial instruments mentioned, may have acquired such positions at prices no longer available, and may have interests different from or adverse to your interests or inconsistent with the advice herein. Ironsides Macroeconomics or its affiliates may advise issuers of financial instruments mentioned. No liability is accepted by Ironsides Macroeconomics, its officers, employees, affiliates or partners for any losses that may arise from any use of the information contained herein.
Any financial instruments mentioned herein are speculative in nature and may involve risk to principal and interest. Any prices or levels shown are either historical or purely indicative. This material does not take into account the particular investment objectives or financial circumstances, objectives or needs of any specific investor, and are not intended as recommendations of particular securities, investment products, or other financial products or strategies to particular clients. Securities, investment products, other financial products or strategies discussed herein may not be suitable for all investors. The recipient of this report must make its own independent decisions regarding any securities, investment products or other financial products mentioned herein.
The material should not be provided to any person in a jurisdiction where its provision or use would be contrary to local laws, rules or regulations. This material is not to be reproduced or redistributed to any other person or published in whole or in part for any purpose absent the written consent of Ironsides Macroeconomics.
© 2019 Ironsides Macroeconomics LLC.