Bund Dot Com
Secular bond bear market, election year uncertainty and capex, September was a bigger employment outlier than October FOMC focus on QT, fade the Trump Trade
Bund Dot Com
One of our strongest secular thematic views is the 39-year bond bull market that began while we were studying economics as an undergrad ended in 2020, and we have begun a secular bear market. Integral to our thesis are two critical policy factors that were drivers of the 1951-1981 persistent rising rate regime. The first is the unwinding of the Federal Reserve longer maturity interest rate suppression. In the post-war era this meant ending interest rate caps initiated to finance war debt. In the ‘20s, this is reducing the Fed’s holdings of longer maturity Treasuries and agency mortgage-backed securities initially intended to avoid a repeat of 1930’s deflation. The second factor is increasing government spending as a percentage of aggregate output and income.
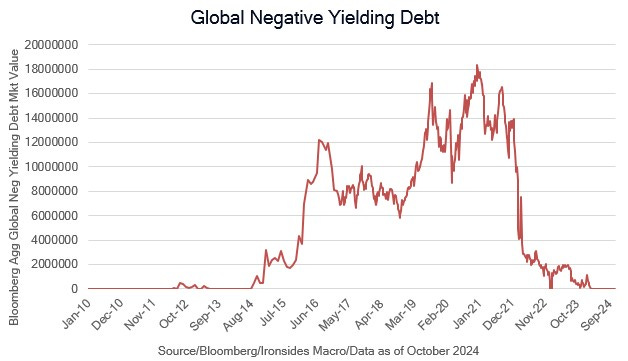
Although we branded our work, ‘It’s Never Different This Time’, we are careful to note it is never quite the same as the last time. For example, two major supply shocks in the most critical global resource, energy, occurred during the final third of the ‘51-’81 bear market. We had a similar shock that kicked off the ‘20s bear market. In the earlier era, the US position in energy balance had slipped from a surplus into a deficit. The energy trade balance has returned to surplus, though one of the two dominant political parties appears committed to government control over the energy sector, a sure-fire path towards derailing US energy sector growth. Before moving to the implications for investors following next week’s consequential election, we wanted to add an anecdote with all due to credit to the always thought-provoking Jim Grant. In a CNBC interview, Jim characterized the peak of ~18 trillion of global negative yielding debt as analogous to the Dotcom era. We titled this section bund.com due to Germany’s role at the center of the bond mania, the equivalent of pets.com we suppose. It struck us that the negative equity risk premium for the S&P 500 in the late ‘90s and negative yielding debt, as well as negative interest rate monetary policy, as similarly manias. We don’t overuse the term bubble, but tech stocks in the late ‘90s and bonds in the early ‘20s were right up there with tulip bulbs.
During a CNBC interview on Wednesday, we rejected the premise that the expansion of government spending relative to the economy has had no impact on the interest rate the government pays to finance the growing debt. In both 1Q21, during the passage of the $1.9 trillion American Rescue Plan Act, and in 3Q23 when Treasury attempted to extend the duration of issuance (term out the debt), there were sharp moves in the part of the curve least impacted by the Fed’s balance sheet, 30-year real (inflation protected) rates. In both cases actions from the Treasury, let’s use Stephen Miran’s term ATI (Active Treasury Issuance), and the FOMC, stopped the increase in rates. Another indicator we didn’t mention during our CNBC interview is the 30-year swap spread at -84bp, an all-time low. A literal reading of swap rates below the Treasury yield is the credit of the swap dealer is better than the US government, in reality the negative spread is attributable to supply. Treasuries are cheap due to over abundance.
Here is the paper we mentioned in our CNBC interview, we reviewed it in On the Ledge.
Government Debt in Mature Economies. Safe or Risky?
In this week’s note we discuss slowing capital investment due to election year uncertainty, review the messy employment report, preview the FOMC meeting, and as usual provide our latest thoughts on our sector and asset allocation suggestions including a potential post-election opportunity to buy fixed income duration.


