


2020 Taxpayer Revolt?
2020 Taxpayer Revolt?
Next year's election is likely to have tax policy as a central issue

This week’s note is available to both our paid and free subscribers. Like our Socialism, Capitalism and Mercantilism September 28, 2019 note, this is a thought piece that we hope can serve as a reference as the 2020 election tax issues come into focus.
We attended President Trump’s Economics Club of New York (ECNY) address this week and concluded that the central theme in the administration’s case for reelection of most interest and consequence for investors, is tax policy. Greg Ip of the Wall Street Journal made an interesting case this week that the state of the economy will be less important in the 2020 outcome, while his thesis has merit, we would differentiate between economic growth and tax policy¹. As Mr. Ip notes, voters have deeply divided narratives about who deserves attribution for the strong condition of the labor market. However, last week’s election results in ‘red’ Texas, ‘purple’ Colorado and ‘deep blue’ Washington, point to a limit on voters support for tax increases. Texas made it all but impossible to enact a state income tax, Colorado rejected a proposal to weaken the Taxpayer Bill of Rights (TABOR) and Washington voters, in the state’s ‘advisory vote’ system, urged the legislature to reject $19.5bn in tax hikes including corporate, financial sector and high-end home hikes². While the Trump administration has not offered any formal tax policy agenda for a second term, the ECNY speech stands in sharp contrast with the proposals of the Democratic Party candidates. As Paul Tudor Jones said on CNBC Wednesday morning, a Democratic in the White House ‘will be accompanied by higher taxes’. Of course, both the Democratic candidate and control of the Senate will influence the magnitude of the change in tax policy. However, all of the candidates appear determined to reverse corporate tax reform, which in our view, is achieving Brady, Ryan, Hatch and the administration’s objective of boosting capital investment. In this note, we will make our case for preserving the restructuring of the corporate tax code and offer our outlook for the federal budget.
¹”It’s Not the Economy Anymore, Stupid”, Greg Ip, November 12, 2019 Wall Street Journal

Figure 1: The NFIB small business survey asks about proprietors ‘single biggest problem.’ Taxes and excessive regulation concerns eased steadily through the Clinton and Bush Administrations, rose throughout President Obama’s two terms, and have fallen during the Trump era. The number of small businesses calling it a ‘good time to expand’ has continued its recovery from the depths of the Global Financial Crisis in recent months despite trade policy uncertainty.
The Corporate Tax Code was a Mess
In March 2017, the Congressional Budget Office (CBO) published an “International Comparisons of Corporate Income Tax Rates”³ for the G20, analyzing statutory, average and effective marginal rates. Statutory rates influence where to book profits and expenses. Average rates influence where to invest and effective rates affect the decision to add to a company’s existing capital stock. The US had the highest statutory rate, third highest average rate and fourth highest effective marginal rate (figure 2). The report updated a similar analysis a decade earlier and noted that corporate tax rates had fallen in virtually all G20 countries with the US a notable exception. The uncompetitiveness of the corporate tax code explains $2.6 trillion in offshore profits, inversions, and was a contributing factor in the ‘10s being the second weakest business cycle for nonresidential fixed investment since WWII.
³https://www.cbo.gov/sites/default/files/115th-congress-2017-2018/reports/52419-internationaltaxratecomp.pdf

Figure 2: Even with corporate ‘loopholes’, known by economists as tax expenditures, the US corporate tax code made the US an unattractive destination.
The section on effective rates integrated cost or depreciation allowances and interest deductibility to determine the marginal rate on equipment, building and intellectual property investment. The report noted that in most countries cost allowances were ‘more advantageous for buildings than equipment. However, under US law the reverse is true.’ The report went on to conclude that for debt financed equipment investment, the US had the second lowest effective rate and for equity financed buildings the US had the second highest rate. The structure of the tax code is at least consistent, if not explanatory, of equipment investment at a post-WWII high relative to GDP and structures investment at its post-war low. The 2018 Tax Cuts & Jobs Act cut in the statutory rate from 35% to 21% reduces the present value of cost allowances and interest expense. However, because the law passed under reconciliation it needed to be scored by the CBO as budget neutral over 10 years. Consequently, there are some provisions that expire in the middle of the next administration’s term. TCJA increased the cost allowance for equipment from 50% to 100%; however, that provision expires after 2022. Additionally, research and development has been an expense in the first year since 1954, after 2022 it will have to be amortized over 5 years unless it is made overseas then the period extends to 15 years. The limitation on interest expense capped at 30% of earnings before taxes, interest, depreciation and amortization, also makes debt-financed investment less attractive. These imbedded changes could make for some very interesting political negotiations with either a Trump Administration in its home stretch with little political capital remaining and most likely, a growing federal debt and large deficit, or a Democratic administration faced with an even more acute fiscal crisis and a less favorable view on tax policy.
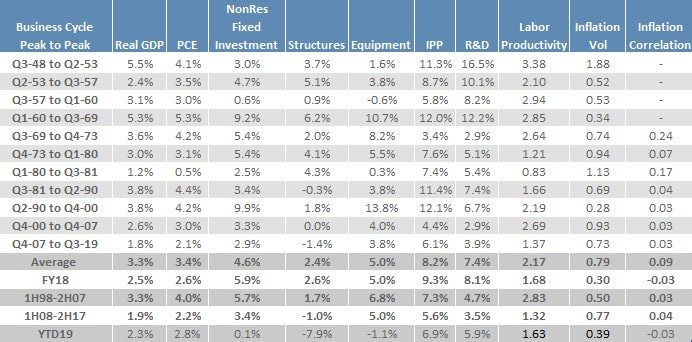
Figure 3: This has been a long, slow growth, weak investment and below trend productivity cycle. Since TCJA passed productivity has improved, our fundamental corporate sector level work points to technology innovation adoption.
Tax Cuts & Jobs Act Individual Tax Code: Mostly Politics
The changes in the individual tax code had no apparent impact on personal consumption expenditures (PCE), in 2018 PCE grew 2.6%, year to date in 2019 PCE has increased 2.8%, right at the 2014-2017 average of 2.75%, better than the prior ten year average of 2.2%, though not as strong as the post-war average of 3.4%. While the changes to the individual portion of TCJA did not boost consumer spending in the near term, it did cause a one year disruption to the housing market like the ’86 Tax Reform did. In the long run, the elimination of itemized deductions should increase economic efficiency by reducing the incentive to invest in areas favored by the prior tax code including housing. The economic and political calculus of the individual tax code are divergent in the sense that the changes in TCJA appeared designed at least partially to sell corporate tax reform to the public. The vote in deep blue Washington against the type of taxes that appeal to the left leaning portion of the population is a case in point. For the persuadable center, what they are likely to hear is one side that wants to raise taxes and another that wants to cut them. The subtleties of changes in the tax code in terms of economic efficiency or investment incentives are important for investors; however, the public generally believes that one tax increase generally leads to another. One final point, an empirical observation, often referred to as ‘Hauser’s Law’, notes that regardless of the progressivity of the tax code, federal receipts expressed as a percent of GDP since WWII average 17%, since TCJA passed the average is 17%. Under Truman and Eisenhower the top marginal rate was 90+%, under Reagan 28%, receipts relative to GDP were the same. Receipts grew 4% in fiscal year 2019, the same rate as nominal GDP, however, spending increased 8.2% and consequently is the reason for the widening deficit. The chart below shows the effect of four significant flattening of the individual tax code on federal individual income tax receipts relative to GDP, in each case receipts went up though the fourth episode – TCJA – is a CBO forecast, we suspect their estimate is low. Economic forces, not tax policy, drove the deviations from the mean in our view. Corporate tax receipts have never been a significant contributor, any spending proposals financed by expected corporate tax receipts are fanciful.
https://ironsidesmacro.substack.com/p/housing-another-echo-of-88
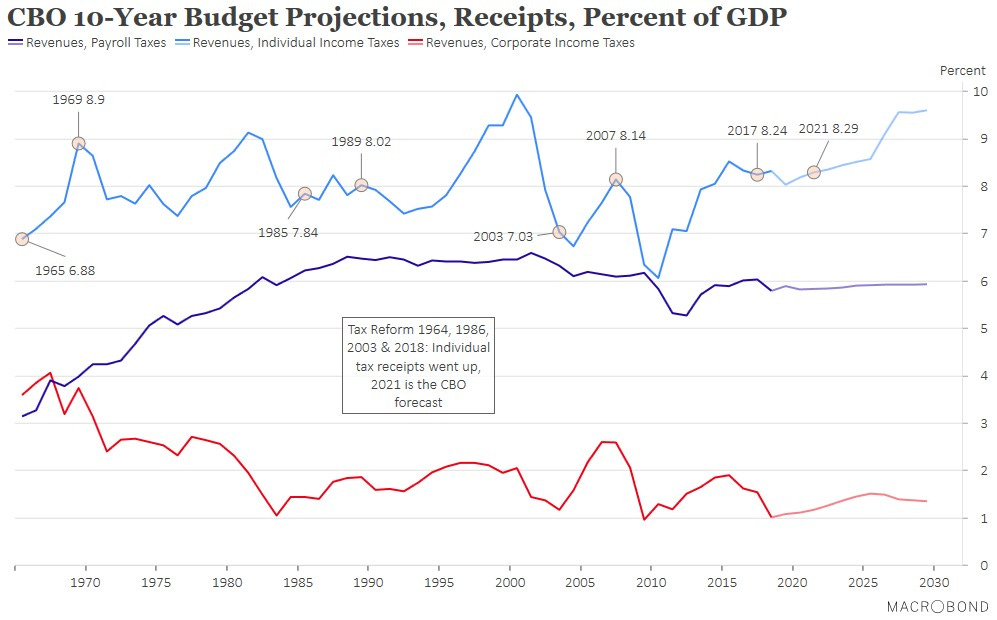
Figure 4: Individual income tax receipts have been far less sensitive to the relative progressivity of the tax code than most economists who have you believe, let alone politicians. No amount of corporate taxes can resolve the budget issues.
TCJA: The Boost to Capital Investment
The impact of TCJA on investment was immediate and profound due to the associated surge in business confidence, and while the Trump Trade War has reversed the positive confidence shock, positive effects persist. In 2018, nonresidential fixed investment grew 5.9%, well above the prior ten-year average of 3.4%, expansion average of 2.9% and post-war 3.4% rate. In 2019, investment has slowed to 0.1%; however, divergences between the components discussed earlier are stark. Structures investment was the biggest beneficiary of the change in the tax rate, in 1H18 it surged 13% only to slow sharply in 2H18 and fall 7.9% in the first three quarters of 2019. We suspect the size and scope of these investments makes them most sensitive to business confidence, consequently the trade war is the likely culprit, though notably, manufacturing physical plant has been steadily improving for several years albeit from a depressed base. Structures investment was 4% of GDP for four decades until globalization, technology and an unfavorable tax code combined to cause a three-decade decline to less than 3%. While the change might seem small, the long life of these assets means that the step down in the rate of growth has lead to a large decline in the total physical capital stock. Technology is likely to continue to depress physical investment; however, deglobalization and an improved tax code are now tailwinds. As we detailed earlier, TCJA had little impact on the effective marginal tax rate for equipment investment and sure enough in 2018, it grew 5%, right at the post-war and prior 10-year average of 5%. The 1.1% drop in 2019 is likely due to the trade war with the impact on oil exacerbating the weakness (figure 6). For most economists on the street this category is capital investment due to measurement difficulties in the increasingly important intellectual property category. In other words, if a purveyor of the narrative that TJCA did not work as intended has actually looked at the numbers, they are talking about equipment and are committing economic malpractice by ignoring the strength in intellectual property investment, primarily software and R&D, as well as the obvious negative effect of the trade war.
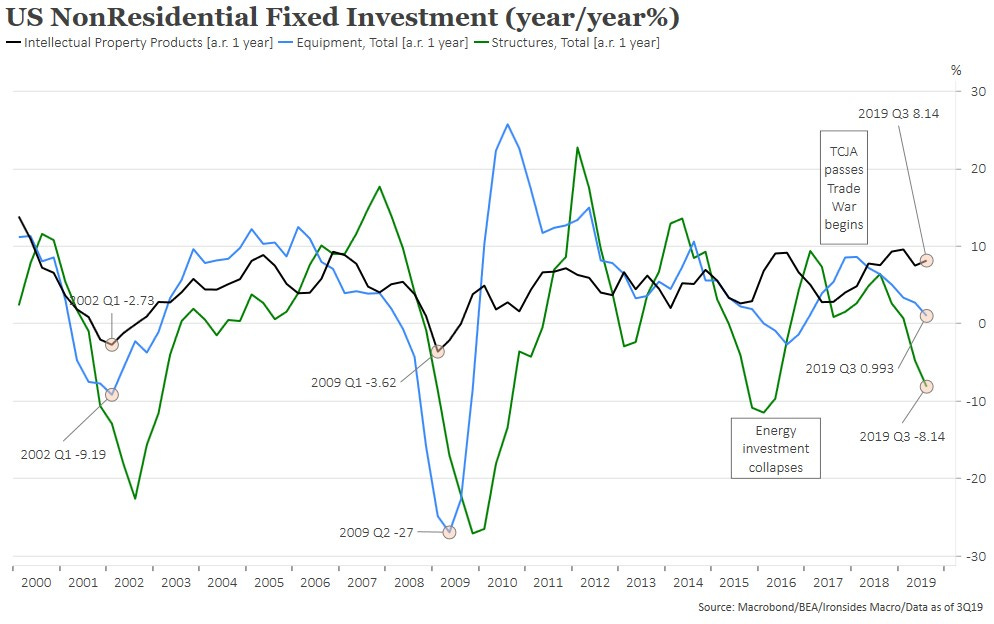
Figure 5: Until 2013 the BEA considered intellectual property investment - primarily software and R&D an expense. They have consistently revised their first guesstimates higher. As a percent of GDP it has risen from less than 1% of GDP in the ‘60s to 5%.
Will Election Uncertainty be Larger than the Trade Shock?
This brings us to the outlook for what is likely to be yet another year of elevated public policy uncertainty. There is evidence that capital investment tends to run below trend during election years⁴ and the 2020 election is likely to make long-term capital planning difficult given the position of the Democratic candidates that they intend to reverse TCJA. On the plus side, the economy absorbed and has adjusted to a significant uncertainty shock from the President’s trade war and assuming no additional tariffs, implies a recovery in business confidence. Our expectations are that structures investment will continue to struggle due to policy uncertainty; however, equipment investment should recover if only to capitalize on immediate expensing if it appears a Democratic candidate might win. Finally, the software investment boom is secular, TCJA helps on the margin, but it is likely to be resilient under any conditions short of a recession. R&D is a bit more interesting, it has been booming since TCJA passed. Accounting could be part of the story; there is less incentive to book profits offshore so the increase might be a partial offset. It could be the improvement in cash flow or the pending change in 2022 where the cost will have to be amortized. We will be watching closely, for now we will take the increase in R&D as good news for total factor productivity, which is the residual between output, labor and capital inputs generally assumed to be derived from innovation.
⁴“Political Uncertainty and Corporate Investment Cycles”, Brando Julio and Youngsuk Yook https://onlinelibrary.wiley.com/doi/epdf/10.1111/j.1540-6261.2011.01707.x
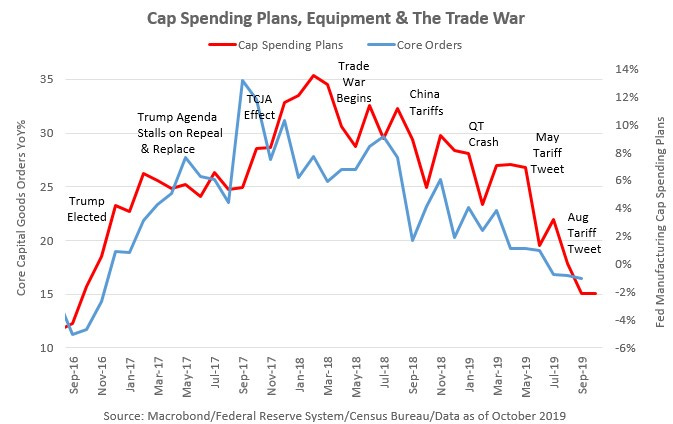
Figure 6: Our capital spending plans index is derived from five regional Fed manufacturing 6-month capital spending question. The trade war has led to a reversal of the deregulatory policies and TCJA during the first year of the Trump administration. The declines and brief periods of stabilization have followed the trajectory of tariffs and truces with such precision there can be little doubt as to the cause of the deterioration.
Rising Debt and Deficits: They don’t matter, yet…
In the early ‘90s and again in the early ‘10s recessions had led to rising debt and deficits and bipartisan deals to raise taxes and ultimately slow the growth of spending, relative to GDP. The ’91 budget deal made by a Republican President and a Democratic Congress cost the Republican President a second term and later the Democrats control of Congress. The 2011 budget and debt ceiling battle did not cost President Obama a second term, but was a contributing factor to the GOP later gaining control of the Senate. Although both parties seem to be easing towards modern monetary theory, we expect pressure to build after the 2021 election that will lead to a deal that leans on additional revenues in some form. If the President wins a second term, he will likely have only one opportunity for significant legislation. A tax bill that flattens rates further paid for with a reduction in expenditures would be optimal though an immigration bill that increases the population growth rate could have similar long-term economic benefits given the size of the debt. There are two primary ways to increase potential growth, increase the growth in population or productivity. Productivity increase per capita GDP and the standard of living, population does not, but it does help pay debt.
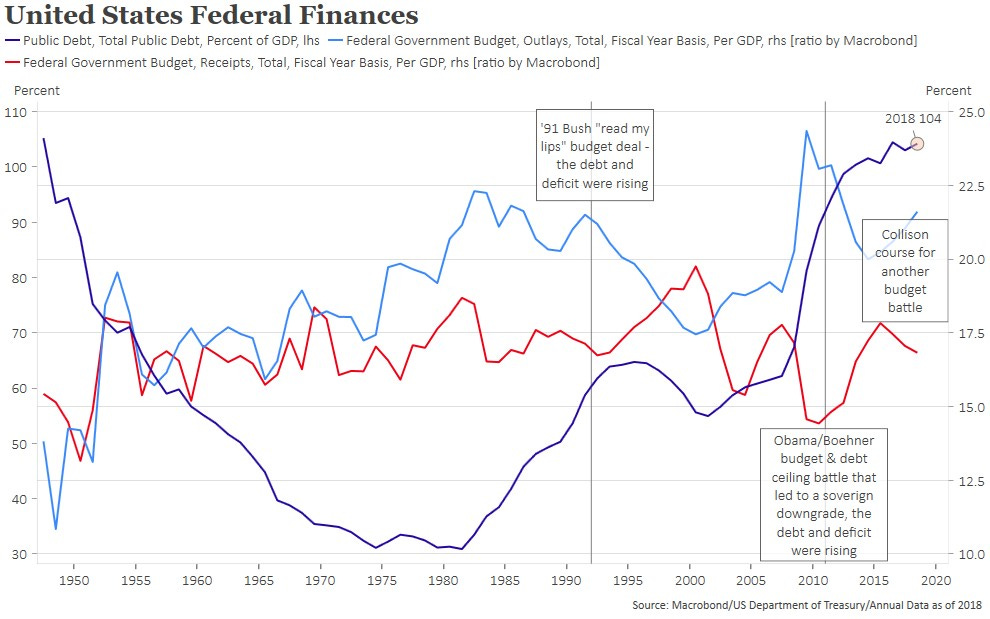
Figure 7: When the debt and deficit were rising simultaneously in the early ‘90s and ‘10s a political crisis developed that lead to a slower rate of growth of spending and tax hikes. Those were caused by cyclical factors, the debt growth is now structural.
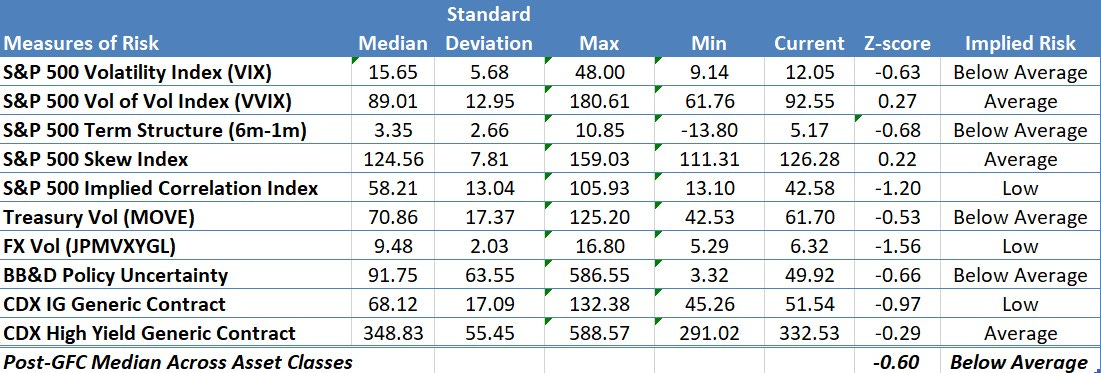
Measures of Risk
Equity market measures of risk appear are solidly on the low side. However, low volatility tends to persist, as opposed to high volatility spikes. Consider it a necessary, but not sufficient condition for a price correction. Treasury and FX volatility are low and credit spreads are tight. If the President follows through on his Tuesday threat to hike tariffs if the Chinese General Secretary balks at a phase 1 deal, even with favorable seasonality a decent risk off event could develop. We still rate this as a low probability outcome, however, given the magnitude of returns this year some downside protection is warranted.
Barry C. Knapp
Managing Partner
Ironsides Macroeconomics LLC
908-821-7584
https://ironsidesmacro.substack.com
https://www.linkedin.com/in/barry-c-knapp/
@barryknapp
This institutional communication has been prepared by Ironsides Macroeconomics LLC (“Ironsides Macroeconomics”) for your informational purposes only. This material is for illustration and discussion purposes only and are not intended to be, nor should they be construed as financial, legal, tax or investment advice and do not constitute an opinion or recommendation by Ironsides Macroeconomics. You should consult appropriate advisors concerning such matters. This material presents information through the date indicated, is only a guide to the author’s current expectations and is subject to revision by the author, though the author is under no obligation to do so. This material may contain commentary on: broad-based indices; economic, political, or market conditions; particular types of securities; and/or technical analysis concerning the demand and supply for a sector, index or industry based on trading volume and price. The views expressed herein are solely those of the author. This material should not be construed as a recommendation, or advice or an offer or solicitation with respect to the purchase or sale of any investment. The information in this report is not intended to provide a basis on which you could make an investment decision on any particular security or its issuer. This material is for sophisticated investors only. This document is intended for the recipient only and is not for distribution to anyone else or to the general public.
Certain information has been provided by and/or is based on third party sources and, although such information is believed to be reliable, no representation is made is made with respect to the accuracy, completeness or timeliness of such information. This information may be subject to change without notice. Ironsides Macroeconomics undertakes no obligation to maintain or update this material based on subsequent information and events or to provide you with any additional or supplemental information or any update to or correction of the information contained herein. Ironsides Macroeconomics, its officers, employees, affiliates and partners shall not be liable to any person in any way whatsoever for any losses, costs, or claims for your reliance on this material. Nothing herein is, or shall be relied on as, a promise or representation as to future performance. PAST PERFORMANCE IS NOT INDICATIVE OF FUTURE RESULTS.
Opinions expressed in this material may differ or be contrary to opinions expressed, or actions taken, by Ironsides Macroeconomics or its affiliates, or their respective officers, directors, or employees. In addition, any opinions and assumptions expressed herein are made as of the date of this communication and are subject to change and/or withdrawal without notice. Ironsides Macroeconomics or its affiliates may have positions in financial instruments mentioned, may have acquired such positions at prices no longer available, and may have interests different from or adverse to your interests or inconsistent with the advice herein. Ironsides Macroeconomics or its affiliates may advise issuers of financial instruments mentioned. No liability is accepted by Ironsides Macroeconomics, its officers, employees, affiliates or partners for any losses that may arise from any use of the information contained herein.
Any financial instruments mentioned herein are speculative in nature and may involve risk to principal and interest. Any prices or levels shown are either historical or purely indicative. This material does not take into account the particular investment objectives or financial circumstances, objectives or needs of any specific investor, and are not intended as recommendations of particular securities, investment products, or other financial products or strategies to particular clients. Securities, investment products, other financial products or strategies discussed herein may not be suitable for all investors. The recipient of this report must make its own independent decisions regarding any securities, investment products or other financial products mentioned herein.
The material should not be provided to any person in a jurisdiction where its provision or use would be contrary to local laws, rules or regulations. This material is not to be reproduced or redistributed to any other person or published in whole or in part for any purpose absent the written consent of Ironsides Macroeconomics.
© 2019 Ironsides Macroeconomics LLC.