


Will the Intruder Retreat?
Will the Intruder Retreat?
Regulatory reform gets derailed by the trade war

We are sending the full note to everyone this week, we thought it important to convey the message to all of our subscribers. In the coming weeks we will introduce a new asset allocation product and will update our client chart book. If you are not already, please consider becoming a paid subscriber.
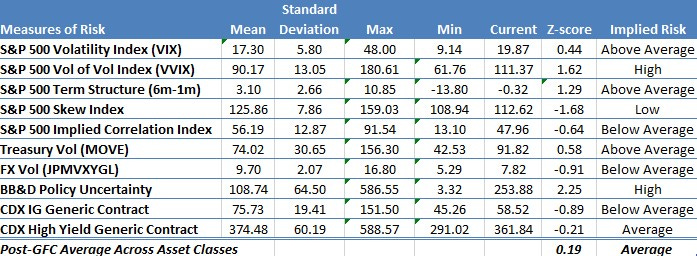
Weak trade data from Singapore, Taiwan, Japan, and South Korea, August purchasing manager surveys from Germany, EU, Japan and the US below the 50 boom/bust line, Mexico’s second quarter of no economic growth, pressure on high yielding emerging market currencies and only average levels of market implied risk had the US equity market in a vulnerable condition prior to Friday morning’s US/China trade war escalation. To be sure, the news flow after Friday’s market close, the President’s threat to invoke the International Emergency Economic Powers Act, increased tariffs, and increased violence in Hong Kong all point in the direction of the S&P 500 reaching our downside objective near the May low another 100 points lower. We would add back some of the cyclical exposure we recommended reducing in August 2 note around 2750 if we reach extremes - at least one standard deviation above the post-crisis mean - in several of the market measures of risk in the table below.
The President’s trade war and threat to use the Emergency Economic Powers Act to restrict US companies from trading with China is reminiscent of two similar attempts by Presidents to solve misdiagnosed problems using powers that Congress should have never provided. The first, Richard Nixon’s August 1971 wage and price controls, created a national emergency - gas lines - after he had cruised to victory in an election that could parallel 2020 depending on who the Democrats nominate. The second was Jimmy Carter’s 1980 credit controls which caused the ISM Manufacturing Survey to fall from 50.2 in February to 29.4 in May and his lead 18 point lead over Ronald Reagan in March to end in a 9 point loss.
What’s a Central Bank to do?
“Without question, it’s a complex ecosystem in which central bankers seek an equilibrium. And our setting here in the Grand Teton National Park is perhaps the ideal place to contemplate such challenges given the very complex natural ecosystem that exists here. You will find that the national park is home to a variety of species – elk, moose, bison, and grizzly bears to name a few. These animals co-exist in an equilibrium that provides mutual benefits when they respect each other’s territory. As the park rangers will tell you, some of these animals establish large territories referred to as home ranges. When the home ranges of different animals overlap, or one animal intrudes on another’s territory, things get a little more interesting. That said, the park rangers assure me that such encounters or even aggression are generally resolved without bloodshed, typically with retreat of the intruder.”
Opening Remarks by Esther L. George at Jackson Hole Economic Policy Symposium¹
As the Fed gathered in Jackson Hole for the annual Kansas City Fed economic symposium, we found it notable that only regional Federal Reserve Bank presidents were giving media interviews. The tone of Philly Fed President Harker, Kansas City Fed President George, Cleveland Fed President Mester and Boston Fed President Rosengren’s comments this week were clearly hawkish, Dallas Fed President Kaplan, Minneapolis Fed President Kashkari and St. Louis Fed President Bullard’s comments less so. Given the interviews occurred after the release of the minutes of the late July meeting that showed less than unanimous support for the July easing, it seems probable that an easing cycle driven by administrations trade policy and the associated increase in the dollar, is controversial within the Committee. They will likely be easing in September unless the intruder has retreated.
We found the following statement from the minutes from the July ECB meeting particularly insightful…
In considering the outlook and risks for the external environment, members referred to ongoing uncertainties related to trade tensions, the United Kingdom’s withdrawal from the EU and the rotation in the Chinese growth model from manufacturing investment towards consumption and services. In this context, it was underlined that the main causes of the slowdown in euro area activity lay outside the euro area.²
This statement from the ECB, and German finance officials’ statements about the appropriate fiscal response to a German recession, imply there is no acceptance that markets forces are causing deglobalization and the politicians promoting barriers to trade are not making history, they are being made by history. In the meantime the ECB staff is preparing a ‘policy package’ of asset purchases, rate cuts and lending programs that will deepen the state’s involvement in the capital allocation process, further impair bank credit creation and attempt weaken the Euro despite the large current account surplus. Additional ECB easing without German economic reform will only postpone the inevitable process of creative destruction.
Currency instability is likely to intensify and one of the papers presented on Saturday at Jackson Hole, “Mind the Gap in Sovereign Debt Markets: The US Treasury basis and the Dollar Risk Factor”³, explains the how the global scarcity of dollar safe assets has increased since the Global Financial Crisis. Krishnamurthy and Lustig demonstrate how as financial conditions tighten, for example in a risk-off event due to a trade war, the scarcity of ‘safe’ dollar assets will drive the dollar exchange rate higher even when trade related demand for the currency is falling. The drop in the yuan on Friday after the escalation is a micro example, this will definitely make the intruder angry.
¹https://www.kansascityfed.org/~/media/files/publicat/sympos/2019/georgeopeningremarks82219.pdf?la=en
²https://www.ecb.europa.eu/press/accounts/2019/html/ecb.mg190822~63660ecd81.en.html

We offered the above chart to put the trade deal President Trump and Prime Minister Abe in perspective, in other words it won’t move the needle.
Deregulation
We had a conversation this week with a client about the effect of deregulation, a topic we have written about repeatedly for the last couple of years generally focused on the financial sector and labor market. Our definition of regulatory policy includes taxation; higher taxes act like increased regulation, tax expenditures or deductions, are also a form of regulation, as are tariffs and non-tariff barriers. In short, any interference with the market by the state, regardless of the intent, falls into our definition of increased regulation.
The Trump administration began an ambitious regulatory reform campaign in 2017, beginning with the financial sector. Because Dodd Frank was structured to provide vast administrative discretion they were able to loosen policy considerably, that also implies that another administration could easily reverse the steps they took. The administration instituted a policy of eliminating two regulations for each new one, enforced cost/benefit analysis for federal agencies and therefore slowed the growth of federal regulations sharply. The Tax Cuts & Jobs Act (TCJA) reduced corporate tax rates, limited the deduction for interest expense, and eliminated the taxation of foreign profits subject to a minimum rate while increasing the deduction for capital equipment expenditures. TCJA increased the standard and child credit deduction, offset by capping state & local tax and mortgage interest deductions. On the increased regulatory policy side of the ledger, the average tariff on imports has doubled. While the healthcare and technology have thus far avoided explicit changes, the Trump administration has consistently threatened a range of increased regulations on drug prices and antitrust measures targeting technology companies.
We have three methods for quantifying the impact of regulatory policy changes: bank asset mix, labor market dynamism and capital spending. For most of the business cycle, risk-based capital requirements that favored government securities had impaired private sector lending. Business confidence ran persistently below the ‘90s and ‘00s expansions mid-cycle levels thereby contributing to a sluggish recovery in labor market turnover and weak capital formation. There was considerable improvement in all three of our lenses on the effect of what Hayek called the ‘Administrative State’ during 2017 and most of 2018 until the Trump Trade War effects stalled the recovery.
Unwinding Financial Repression
Prior to the US Treasury financial sector reform proposal released in June 2016 we had been negative on financial sector equities, though generally positive on credit, since prior to the financial crisis. Our core thesis was that a version of financial repression like the post-WWII period would cap return on equity below 10% and they would struggle to earn their cost of capital. Bank stocks performed poorly through the ‘50s as Fed explicit rate caps and tight regulatory policy impaired credit creation and likely contributed to five recessions in fifteen years.
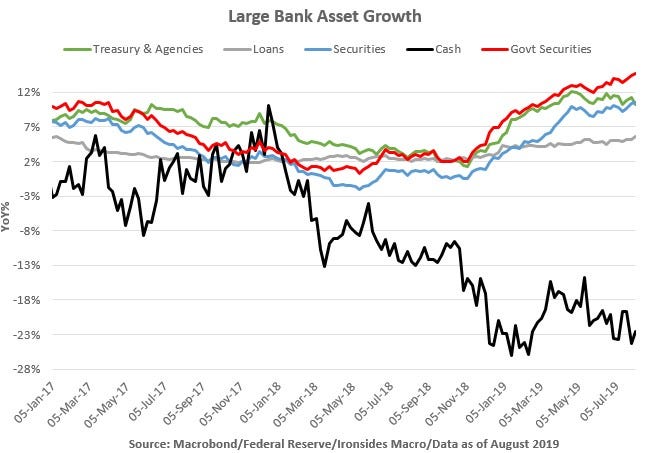
Investopedia defines financial repression as measures by which governments channel funds to themselves as a form of debt reduction. Looser regulatory and diminished Federal Reserve market interventions weakened the public sector capital allocation channel decidedly. Cash peaked in the final month of Fed asset purchases at 19.6% of bank assets and have fallen to 9.6%. Commercial & industrial (C&I) lending has increased from 17.9% of loans in June 2010 to 23.9%. Changes in bank assets from the beginning of the Fed balance sheet contraction through the fall of 2018 were particularly telling; securities holdings growth slowed from 4% to -2% while C&I lending accelerated from 2% to 11%. Core loan growth improved incrementally from 3% to 5%, and remains at that level while the peak in business confidence and policy shift at the Fed likely explain C&I slowing to 7% and securities growth rebounding to 8%. Changes to the mix of bank assets, bank profitability metrics and the increase in M2 growth provide evidence that financial deregulation is reallocating capital to the dynamic private sector. Drawing a broader connection to capital formation, productivity and growth is logical but hardly definitive.
Labor Dynamism and Deregulation
The 2014 Kansas City Fed Economic Symposium primary focus was the labor market and the most important paper was titled “Labor Market Fluidity and Economic Performance”, by Steven J. Davis and John Haltiwanger⁴. Here is the abstract:
U.S. labor markets became much less fluid in recent decades. Job reallocation rates fell more than a quarter after 1990, and worker reallocation rates fell more than a quarter after 2000. The declines cut across states, industries and demographic groups defined by age, gender and education. Younger and less educated workers had especially large declines, as did the retail sector. A shift to older businesses, an aging workforce, and policy developments that suppress reallocation all contributed to fluidity declines. Drawing on previous work, we argue that reduced fluidity has harmful consequences for productivity, real wages and employment. To quantify the effects of reallocation intensity on employment, we estimate regression models that exploit low frequency variation over time within states, using state-level changes in the population composition as instruments. We find large positive effects of worker reallocation rates on employment, especially for men, young workers, and the less educated. Similar estimates obtain when dropping data from the Great Recession and its aftermath. These results suggest the U.S. economy faced serious impediments to high employment rates well before the Great Recession, and that sustained high employment is unlikely to return without restoring labor market fluidity.

⁴https://www.kansascityfed.org/~/media/files/publicat/sympos/2014/2014davis_haltiwanger.pdf?la=en
Turns out as they were conducting their research the end of the most generous extension of unemployment benefits was the likely catalyst for a shift in both the demand for and supply of labor. Their measure of fluidity, the quarterly sum of hiring and separations as a percent of total employment, surged 2.1% in 2014 after averaging a 25bp annualized increase in the first four years of the recovery. The two sectors that account for 40% of total turnover, leisure & hospitality and retail drove the recovery, which continued until February 2016 right on que as 2016 Presidential election related public policy uncertainty effects took hold. Average hourly earnings growth continued to be sluggish until early 2015, increased through September 2016, consolidated for a year before increasing steadily until early 2019. In 2018, productivity growth increased sharply from this cycle’s very weak 1% trend to 1.8% where it remains.

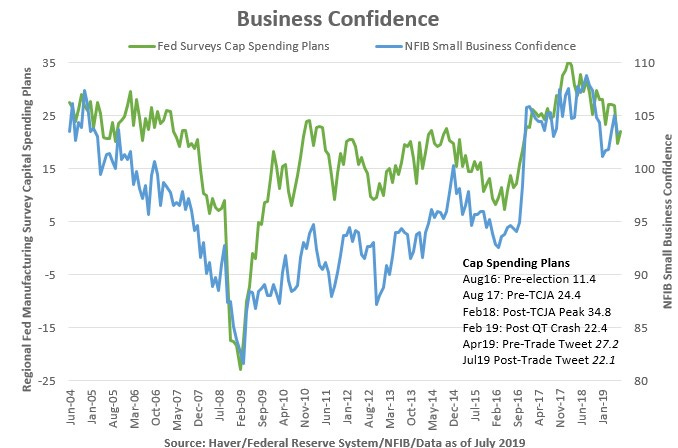
The progression of the manufacturing is particularly insightful. Manufacturing reallocation declined from the beginning of this data in December 2000 until December 2013. Initially the recovery was slow, however, beginning in late 2016 through August 2018 manufacturing sector reallocation surged, job openings, voluntary separations, wages and manufacturing productivity surged. Since the August 2018 peak in business confidence as measured by our regional Fed manufacturing survey capital spending plans index, manufacturing job openings remain elevated but hiring and productivity have slowed significantly. The bottoming of manufacturing labor market fluidity in 2013, slow recovery, followed by an acceleration in 2017 through August 2018 is quite consistent with our view that markets had largely eroded the benefits of outsourcing by the early ‘10s through relative productivity adjusted labor, transportation and energy costs, as well as increased supply chain and exchange rate risks. The US corporate tax code was uncompetitive until TCJA, however, barriers to trade created a shock to the manufacturing renaissance. We view elevated job openings as evidence of strong secular tailwinds for US manufacturing, however, the loss of momentum in manufacturing labor fluidity combined with weaker capital spending plans and purchasing manager surveys falling from boom territory to near contraction points squarely at the Trump trade war as the probable cause.
Taxes & Capital Investment
Following the passage of TCJA capital spending plans and small business confidence rose to their highest levels in two decades. As a consequence S&P 500 capital investment increased sharply after trending lower for most of this business cycle. It is still reasonably firm notwithstanding the narrative of slowing capex that has taken hold in the financial press and with the Fed due to a singular, misguided, focus on equipment rather than intellectual property products. Still, if trade policy uncertainty derails the software investment boom the nascent recovery in productivity could end prematurely and inflation risks will rise even as output slows. This is how President Trump follows the path of Jimmy Carter.

Barry C. Knapp
Managing Partner
Ironsides Macroeconomics LLC
908-821-7584
https://www.linkedin.com/in/barry-c-knapp/
@barryknapp
This institutional communication has been prepared by Ironsides Macroeconomics LLC (“Ironsides Macroeconomics”) for your informational purposes only. This material is for illustration and discussion purposes only and are not intended to be, nor should they be construed as financial, legal, tax or investment advice and do not constitute an opinion or recommendation by Ironsides Macroeconomics. You should consult appropriate advisors concerning such matters. This material presents information through the date indicated, is only a guide to the author’s current expectations and is subject to revision by the author, though the author is under no obligation to do so. This material may contain commentary on: broad-based indices; economic, political, or market conditions; particular types of securities; and/or technical analysis concerning the demand and supply for a sector, index or industry based on trading volume and price. The views expressed herein are solely those of the author. This material should not be construed as a recommendation, or advice or an offer or solicitation with respect to the purchase or sale of any investment. The information in this report is not intended to provide a basis on which you could make an investment decision on any particular security or its issuer. This material is for sophisticated investors only. This document is intended for the recipient only and is not for distribution to anyone else or to the general public.
Certain information has been provided by and/or is based on third party sources and, although such information is believed to be reliable, no representation is made is made with respect to the accuracy, completeness or timeliness of such information. This information may be subject to change without notice. Ironsides Macroeconomics undertakes no obligation to maintain or update this material based on subsequent information and events or to provide you with any additional or supplemental information or any update to or correction of the information contained herein. Ironsides Macroeconomics, its officers, employees, affiliates and partners shall not be liable to any person in any way whatsoever for any losses, costs, or claims for your reliance on this material. Nothing herein is, or shall be relied on as, a promise or representation as to future performance. PAST PERFORMANCE IS NOT INDICATIVE OF FUTURE RESULTS.
Opinions expressed in this material may differ or be contrary to opinions expressed, or actions taken, by Ironsides Macroeconomics or its affiliates, or their respective officers, directors, or employees. In addition, any opinions and assumptions expressed herein are made as of the date of this communication and are subject to change and/or withdrawal without notice. Ironsides Macroeconomics or its affiliates may have positions in financial instruments mentioned, may have acquired such positions at prices no longer available, and may have interests different from or adverse to your interests or inconsistent with the advice herein. Ironsides Macroeconomics or its affiliates may advise issuers of financial instruments mentioned. No liability is accepted by Ironsides Macroeconomics, its officers, employees, affiliates or partners for any losses that may arise from any use of the information contained herein.
Any financial instruments mentioned herein are speculative in nature and may involve risk to principal and interest. Any prices or levels shown are either historical or purely indicative. This material does not take into account the particular investment objectives or financial circumstances, objectives or needs of any specific investor, and are not intended as recommendations of particular securities, investment products, or other financial products or strategies to particular clients. Securities, investment products, other financial products or strategies discussed herein may not be suitable for all investors. The recipient of this report must make its own independent decisions regarding any securities, investment products or other financial products mentioned herein.
The material should not be provided to any person in a jurisdiction where its provision or use would be contrary to local laws, rules or regulations. This material is not to be reproduced or redistributed to any other person or published in whole or in part for any purpose absent the written consent of Ironsides Macroeconomics.
© 2019 Ironsides Macroeconomics LLC.