

The Corona Contraction
We are in recession, look to 1980 for guidance

We are making this week’s full note available to both our paid and free subscribers. If you are a free subscriber, please consider becoming a full subscriber. We will offer a 30-day trial by request, simply email us at bcknapp@ironsidesmacro.com.
The Econocants Dire Forecasts
This week’s spike in initial jobless claims to 281,000 from 211,000 confirmed what the equity market has already discounted; the US economy is in recession. Like March of 1980, the government has put the economy into a coma to try to cure a difficult problem. In 1980, the problem was the Great Inflation and the Carter’s Administration’s restriction of credit plunged the economy into a short, sharp recession to very little effect. In 2020, the contraction might turn out to be even deeper than the 8% 2Q80 plunge in GDP; however, it is likely to slow the spread of the disease and save lives. On Thursday, Dr. Scott Gottlieb, in an Economics Club of New York conference call, described the current stage of the battle with Covid-19, as the accelerating spread phase or steepest part of the curve. Dr. Gottlieb went on to detail a 6-7 week timeline for the spread of Covid-19, peaking in Mid-April and symmetrical downslope, lasting until early June. This implies a resumption of economic activity by the beginning of 3Q in July. When asked what happens to the timeline if the social distancing mitigation strategy is ineffective, Dr. Gottlieb replied that the curve would be steeper, with a much worse outcome, but would peak sooner. While this all sounds pretty grim, given the post-war history of the timing of equity market bottoms relative to the end of recessions, and the magnitude of the associated declines, the timing and current level of the market, implies a bottom could come at any time in or around current levels. To be sure, the policy response is crucial, not just how many mortgages the Fed buys to facilitate refinancing, the structure of the '‘Cares Act” phase three fiscal stimulus, a potential G7 currency accord, but most critically, the timing and process of removing the economy from the government induced coma.

Figure 1: An old colleague once said the 4-week moving average of initial jobless claims doesn’t lie. Others have said if they could have only one economic indicator this would be it. Every recession has been preceded by a 25% increase in claims, we just got 33% in a week with states reporting a surge this week so large some street economists are forecasting the largest single week on record when we get this report Thursday at 8:30.
Guesstimates of the impact of Coronavirus shutdowns are coming fast and furious, jobless claims rising next week to 2+ million, 2Q20 GDP dropping greater than 10% and unemployment rising to 20%. Most of these ‘forecasts’ are largely accounting exercises using linear extrapolation, the disclaimers at the end of the note should be moved to the front page. While we are not dismissive of their analysis, we have long believed the dynamism of the economy, and labor market in particular, is vastly underappreciated. With this mind, consider the construction, retail trade and leisure & hospitality sectors comprise 31.4% of private sector employment and 22.7% of income. With assumptions about duration of the shutdown and the impact on cash flow of these sectors, you can make dire forecasts about the economic impact. Such a forecast omits dynamism and feedback loops. Consider the turnover of these sectors, the quarterly sum of hiring and separations - both voluntary and involuntary - is 33% in construction, 30% in retail and 40% in leisure & hospitality. In February the average duration of unemployment was 22 weeks, the median duration was 9 weeks. In other words, in these sectors, 30-40% of the labor force turns over every quarter, and it takes two months for the median worker to land another job. The effect of a ‘sudden stop’ economy is likely to prove less of an adjustment for employees and employers working in these dynamic, high turnover sectors, than the econocants expect.
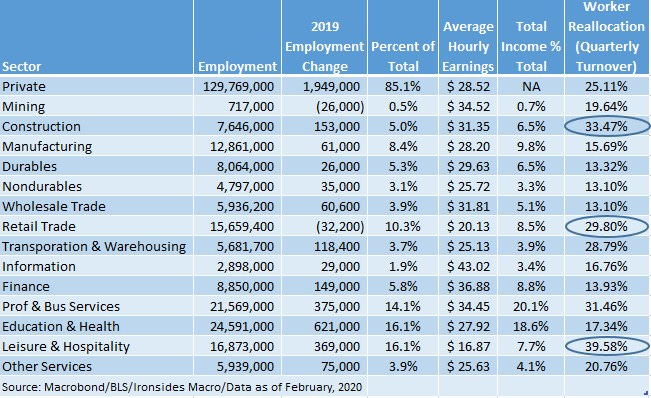
Figure 2: Reallocation is the 3-month sum of hiring and separations as a percent of employment. For the private sector, 25% ‘turns over’ every three months rendering the street’s fascination with the monthly payroll change in most conditions a waste of time. That won’t be true for the March report, though this table is intended to illustrate labor market dynamism.
This is not an argument for a cautious policy response; in fact, our constitution of liberty is an asset in facilitating the flow of information to the policymakers such that they can optimize both the economic support and duration of the Coronavirus mitigation economic coma. For example, section 1105 of the “Cares Act’, offers loan forgiveness, thereby turning loans into grants for companies with less than 500 employees provided they retain employment. A CNBC report quoted an old friend of ours, Larry Lindsey, as describing the Rubio/Collins amendment as a bazooka that could affect 80 million workers and grow much larger than the target of $300 billion. We argued in a media appearance this week¹ for fiscal stimulus that turbocharges the unemployment insurance program; we suggest expanding eligibility and increasing benefits. Leveraging current systems is likely to be more effective than creating new ones. We are however, approaching a tipping point, politicians are risk managing with minimal or flawed cost/benefit analysis in the sense that the health benefits of virus mitigation are reasonably clear, however, the long-term economic costs, that will ultimately be borne by individuals, are more difficult to quantify. When we reach Dr. Gottlieb’s peak in mid-April, we need to bring the patient out of the coma. We are concerned that the shutdowns have gone too far, are based on flawed analysis by politicians who are incapable of understanding markets and the message they are trying to convey.
¹https://www.facebook.com/ironsidesmacro/
Mostly, They Made it Worse
As policymakers respond to the crisis, the long-term costs need to be considered. We long warned about Dodd Frank, Basel risk-based capital requirements and other crisis response regulatory policy. The stated goal of these policies was to transfer risk from leveraged taxpayer supported entities, to less-levered private sector entities. The policies were understandable and predictable, yet they are major contributors to this crisis. While there are many examples, we will focus on a few obvious ones. Because the oldest prime money market fund held Lehman Brothers commercial paper and had to ‘break the buck’ during the financial crisis, prime funds, that can hold private sector assets, were required to float their net asset value while government funds were not. When this regulation went into effect, $1 trillion of assets migrated from funds that can hold private sector assets like commercial paper that fund corporate America’s cash needs, to funds that can only government securities. This week, the Investment Company Institute (ICI) reported the largest ever weekly inflow into government money funds of $249 billion, bringing total assets to $3.1 trillion while prime funds hold $700 billion. Considering that government spending is 20% of GDP, the ratio of government to private sector money fund assets (4.4) is the antithesis of what an unconstrained market economy implies (.2). Perhaps there would still be sufficient capital for the private sector if banks were allowed to treat cash and government securities similarly for purposes of calculating the post-crisis leverage ratio cap. Instead, the repo market froze in September. Meanwhile, the Fed created a commercial paper backstop at 200 bp over Treasuries, a level to wide to resolve this regulatory mess.
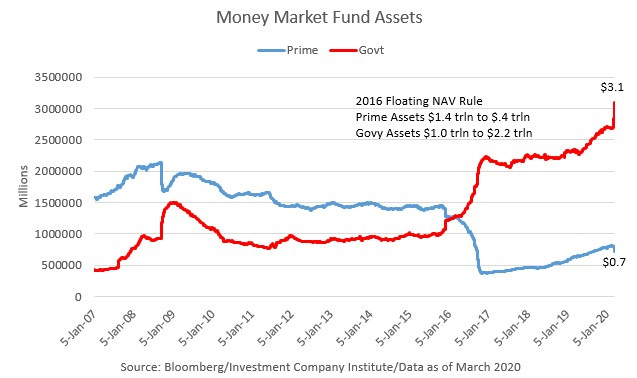
Figure 3: The regulation that prohibited a fixed net asset value for prime funds while exempting government funds is a classic example of financial repression that crowded out private sector finance. The Fed’s backstop at 200 bp over Treasuries is of little use, CP continued wider all week at a point when corporates are drawing on bank lines of credit.
Perhaps the best illustration of the effect of Dodd Frank and Basel risk-based capital requirements is broker dealer holdings of corporate debt. These assets were instead pushed into unlevered funds that provide daily liquidity for illiquid, heterogenous assets. Last week, ICI reported the largest-ever weekly outflow of $32.5 billion. The balance sheet dealers committed to market making during a financial crisis was flexible, that was our job and clients remembered who had courage in a crisis and who did not.
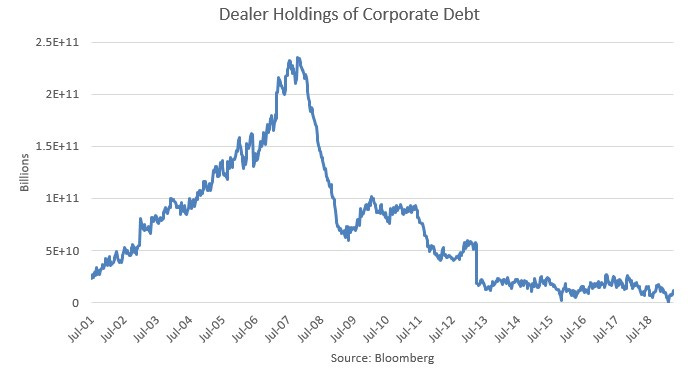
Figure 4: This chart has been making the rounds on the street since the crisis. The Volcker Rule is misguided policy, principal trading reduced losses to taxpayers and the pushing of risk to unlevered, but less regulated entities is making the system more, not less unstable.
This crisis has also laid bare flaws in the equity market. During my 25 years at Lehman/Barclays, the first 15 in equity derivatives, the evolution of our market making capacity was dramatic. By the time I left, in 2014, a new regulatory regime had placed binding restrictions on the ability to increase value at risk and had pushed the market making function from the street to unregulated entities. Much of the local liquidity was provided by algorithmic trading platforms with a fiduciary responsibility to their investors, not customers. They are liquidity takers, not makers. This change in market microstructure lowered local volatility, but created higher volatility of volatility. In other words, when a crisis hit, there was no incentive to make markets, quite the opposite. Perhaps the unique nature of this crisis, the fear of financial and life loss meant volatility should be higher than any crisis since the Crash of ‘29, time will tell, but we are confident that in an attempt to reduce taxpayer liability policymakers made the system less stable. In our haste to provide support to industries most negatively impacted by the economic coma, suboptimal outcomes like banning stock repurchases seem likely.
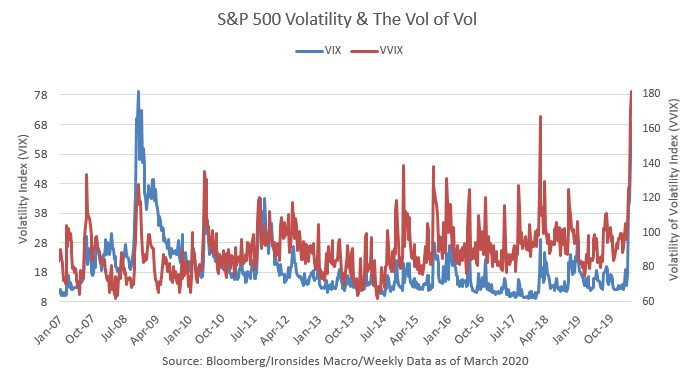
Figure 5: Algorithmic trading systems create an illusion of liquidity, post-crisis the level of implied volatility has generally been low, however the volatility of volatility has been much higher. We attribute these periods of instability to market microstructure inefficiencies largely attributable to regulatory policy.
The Other Side
As the equity market volatility fire begins to burn itself out - the VIX at 80 implies a 5% daily move in the S&P 500 - correlation will fall and investors will focus on the post-Coronavirus environment. Using our second 2020 outlook note² as a starting point, we offer some thoughts on what is likely to work after the storm. Our five macro trends are deglobalization, China not escaping the middle income trap, technology innovation adoption generally and in the healthcare sector particularly, energy becoming investable due to shale technology increasing the elasticity of supply and an inflection in the demand for capital relative to labor. An argument can be made that the Coronavirus could accelerate all of these trends. We are particularly excited about the healthcare sector. The demise of the Sanderviks, poor performance of command and control systems in China and Italy, stumbles from the CDC and WHO, and removal of barriers to use technology to deliver healthcare solutions, have created a tremendous opportunity for the private sector. We would put money to work in the sector. The even more obvious winner is the part of the economy that already had the greatest momentum, software and the cloud. Investment in 5G is going to be a national imperative, this country’s lead in technology is going to expand. The software group was rich, for good reason, before the crisis, it is less so now, we are a buyer.
²https://ironsidesmacro.substack.com/p/macro-trends-for-2020-and-beyond
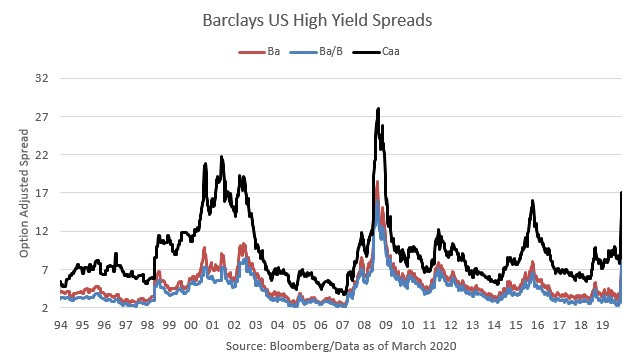
Figure 6: Credit spreads widened sharply this week, though there was some investment grade credit issuance. High yield spreads have not reached the financial crisis or even the TMT bust levels, yet.
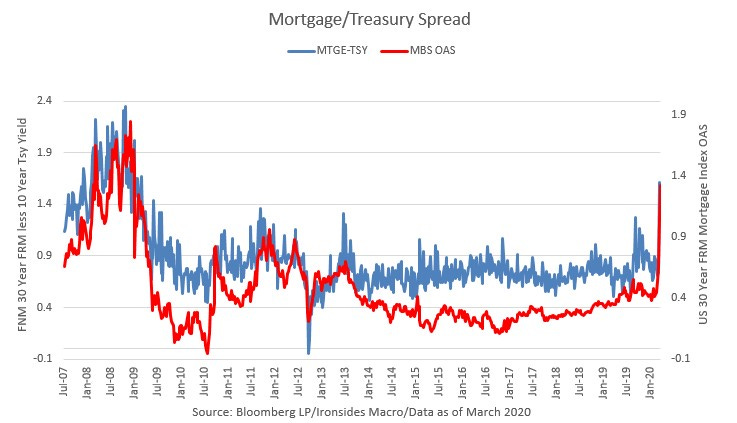
Figure 7: The Fed bought $322 billion of Treasuries and agency mortgage-backed securities this week. Perhaps the simplest way to measure the effectiveness of their purchases is whether they were able to increase market implied inflation expectations. Despite all their purchases, on the week 10-year inflation breakeven rates fell 28bp and real rates increased 25bp. Mortgages widened further, the buying is going to increase considerably next week.
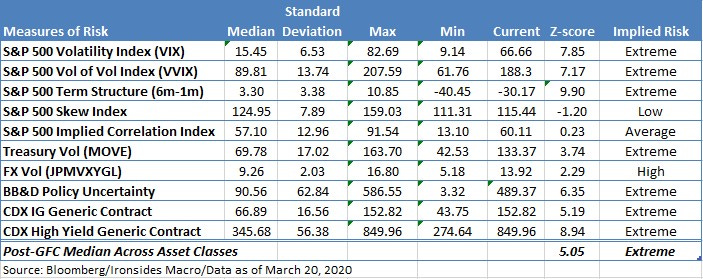
Figure 8: We might be grasping at straws, but skew is now cheap and implied correlation fell sharply this week. This implies investor cash levels are rising and they are beginning to look for opportunities. The relentless rally in the dollar is a major issue that may led to a currency agreement.
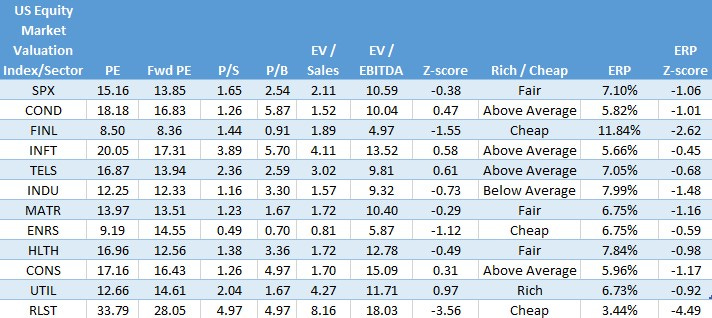
Figure 9: We heard the same strategist reasoning about valuation this week that we heard during the financial crisis. Valuation is irrelevant because we have no idea what the ‘E’ in PE is going to be. Fair enough, but we suspect they are now pretty cheap.
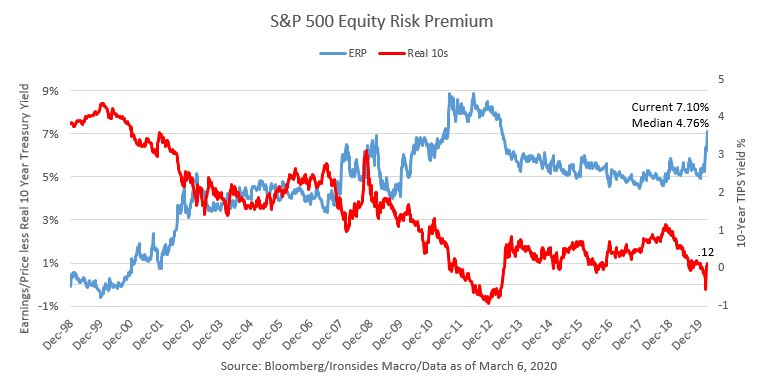
Figure 10: The equity risk premium is higher than in December 2008 ahead of a 56% decline in the ‘E’ and it still was a good buy.
Barry C. Knapp
Managing Partner
Ironsides Macroeconomics LLC
908-821-7584
https://ironsidesmacro.substack.com
https://www.linkedin.com/in/barry-c-knapp/
@barryknapp
Reading List - The first book on the list discusses the role of disease in the Columbian Exchange. You might find it particularly insightful now.
“1493, Uncovering the New World Columbus Created”, Charles C. Mann
“Great Society, A New History”, Amity Shlaes
“The Second Machine Age”, Erik Brynjolofsson, Andrew McAfee
“Showdown at Gucci Gulch, Lawmakers, Lobbyists, and the Unlikely Triumph of Tax Reform”, Jeffrey H. Birnbaum and Alan S. Murray
“Grand Pursuit, the Story of Economic Genius”, Sylvia Nasar
“The Rise and Fall of the Great Powers”, Paul Kennedy
“Capitalism in America, A History”, Alan Greenspan & Adrian Woolridge
“Diversity Explosion, How New Racial Demographics are Remaking America”, William H. Frey
“Clashing Over Commerce, A History of US Trade Policy”, Douglas A. Irwin
“Destined for War, Can America and China Escape Thucydides’s Trap”, Graham Allison
“A Great Leap Forward, 1930s Depression and US Economic Growth”, Alexander J. Field
“The Constitution of Liberty”, F.A. Hayek
“Judgement in Moscow, Soviet Crimes and Western Complicity”, Vladimir Bukovsky
“1931, Debt, Crisis and the Rise of Hitler”, Tobias Straumann
My next book: “Nudge”, Richard H. Thaler & Cass R. Sunstein
This institutional communication has been prepared by Ironsides Macroeconomics LLC (“Ironsides Macroeconomics”) for your informational purposes only. This material is for illustration and discussion purposes only and are not intended to be, nor should they be construed as financial, legal, tax or investment advice and do not constitute an opinion or recommendation by Ironsides Macroeconomics. You should consult appropriate advisors concerning such matters. This material presents information through the date indicated, is only a guide to the author’s current expectations and is subject to revision by the author, though the author is under no obligation to do so. This material may contain commentary on: broad-based indices; economic, political, or market conditions; particular types of securities; and/or technical analysis concerning the demand and supply for a sector, index or industry based on trading volume and price. The views expressed herein are solely those of the author. This material should not be construed as a recommendation, or advice or an offer or solicitation with respect to the purchase or sale of any investment. The information in this report is not intended to provide a basis on which you could make an investment decision on any particular security or its issuer. This material is for sophisticated investors only. This document is intended for the recipient only and is not for distribution to anyone else or to the general public.
Certain information has been provided by and/or is based on third party sources and, although such information is believed to be reliable, no representation is made is made with respect to the accuracy, completeness or timeliness of such information. This information may be subject to change without notice. Ironsides Macroeconomics undertakes no obligation to maintain or update this material based on subsequent information and events or to provide you with any additional or supplemental information or any update to or correction of the information contained herein. Ironsides Macroeconomics, its officers, employees, affiliates and partners shall not be liable to any person in any way whatsoever for any losses, costs, or claims for your reliance on this material. Nothing herein is, or shall be relied on as, a promise or representation as to future performance. PAST PERFORMANCE IS NOT INDICATIVE OF FUTURE RESULTS.
Opinions expressed in this material may differ or be contrary to opinions expressed, or actions taken, by Ironsides Macroeconomics or its affiliates, or their respective officers, directors, or employees. In addition, any opinions and assumptions expressed herein are made as of the date of this communication and are subject to change and/or withdrawal without notice. Ironsides Macroeconomics or its affiliates may have positions in financial instruments mentioned, may have acquired such positions at prices no longer available, and may have interests different from or adverse to your interests or inconsistent with the advice herein. Ironsides Macroeconomics or its affiliates may advise issuers of financial instruments mentioned. No liability is accepted by Ironsides Macroeconomics, its officers, employees, affiliates or partners for any losses that may arise from any use of the information contained herein.
Any financial instruments mentioned herein are speculative in nature and may involve risk to principal and interest. Any prices or levels shown are either historical or purely indicative. This material does not take into account the particular investment objectives or financial circumstances, objectives or needs of any specific investor, and are not intended as recommendations of particular securities, investment products, or other financial products or strategies to particular clients. Securities, investment products, other financial products or strategies discussed herein may not be suitable for all investors. The recipient of this report must make its own independent decisions regarding any securities, investment products or other financial products mentioned herein.
The material should not be provided to any person in a jurisdiction where its provision or use would be contrary to local laws, rules or regulations. This material is not to be reproduced or redistributed to any other person or published in whole or in part for any purpose absent the written consent of Ironsides Macroeconomics.
© 2020 Ironsides Macroeconomics LLC.