


Some Brief Labor Market Thoughts
The public seems skeptical of the 26 million Americans lost their job headline

We are making this brief update available to both free and paid subscribers, if you would like to subscribe to gain access to all of our notes, the research library, chart books and access to the analyst, please click the subscribe button for details.
Details of this morning’s Conference Board consumer confidence survey provided some support for the optimistic outlook implied in the ‘Y’ shaped recovery in the equity market. Like the daily Morning Consult and University of Michigan consumer sentiment surveys, the expectations component improved in April. Improvement in these surveys is far from convincing, frankly it isn’t clear whether these surveys are simply responding to the recovery in stock prices. What we found interesting was the less than we expected drop in the labor differential, the difference between respondents characterizing jobs ‘plentiful’ less those calling them ‘hard to get’. During the drawn out recovery from the financial crisis, we used this indicator to forecast the U6 underemployment rate, however the relationship with the U3 employment rate is also strong. On the surface, the drop from 29.5 to -13.6, due to consumers responding that jobs are plentiful falling to 20% from 43.3% and the percent describing them as hard to get jumping from 13.8% to 33.6%, sounds quite negative. The thing is though, the -13.6 reading is consistent with an unemployment rate a bit over 6%, miles from the rate implied by continuing claims near 14% or the Bloomberg economist survey consensus of 16% for the April employment report.
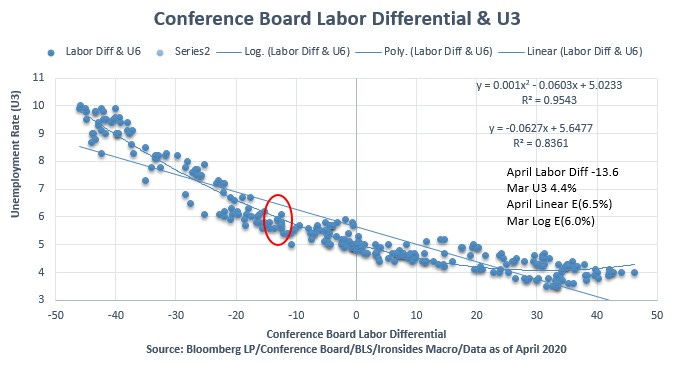
Figure 1: The April labor differential reading is consistent with a 6% April unemployment rate using the logarithmic regression. This is some distance from the 13.8% level implied by the insured employment rate from the continuing jobless claims series and the 16% Bloomberg economist consensus forecast.
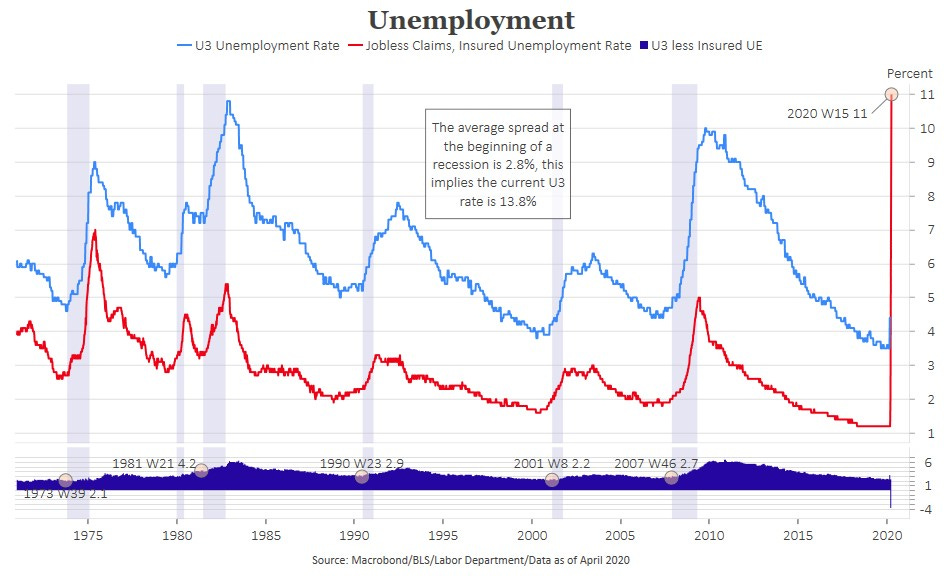
Figure 2: The cumulative increase in initial jobless claims since mid-March is 26.735 million. The press regularly characterizes this total as the number of Americans who have lost their job due to the coronavirus. It might be a compelling headline but it is likely far from accurate. Continuing claims lag initial claims by one week. Using a February baseline of 214,000 average weekly initial claims and 1.710 million continuing claims through the week of April 10 there are 6.972 million that appear to have gone back to work given the difference between baseline adjusted continuing claims (15.976m) and 21.238m adjusted initial claims.
Early in the Corona Contraction we published the table below to illustrate the dynamism of the sectors caught in the vortex of the Coronavirus storm. As a refresher, 40% of leisure & hospitality employment turns over every three months. In the construction sector the quarterly sum of hiring and separations, both voluntary and involuntary, is 34% and in retail churn is 30%. Amidst all the chaos of the population-based stay-at-home orders, PPP loans, expanded and enhanced unemployment insurance benefits, we really have no idea how many workers are furloughed, how many restaurants will not reopen, construction projects will be abandoned and whether this will be the event to accelerate the rationalization of excessive retail floor space. Perhaps the respondents of the Conference Board Survey are being naive, or this is the first serious outlier data point in the 23 years of data points in figure one. Still, it would appear that quite a few more consumers think they still have a job or it’s going to be considerably easier to get one than the media headline of 26 million Americans lost their jobs implies. It’s just one data point point, but given signs of stabilization in vehicle sales, airline bookings and other high frequency indicators, not to mention the performance of the equity market, the economy might be considerably more resilient than the econocants dire forecasts imply.
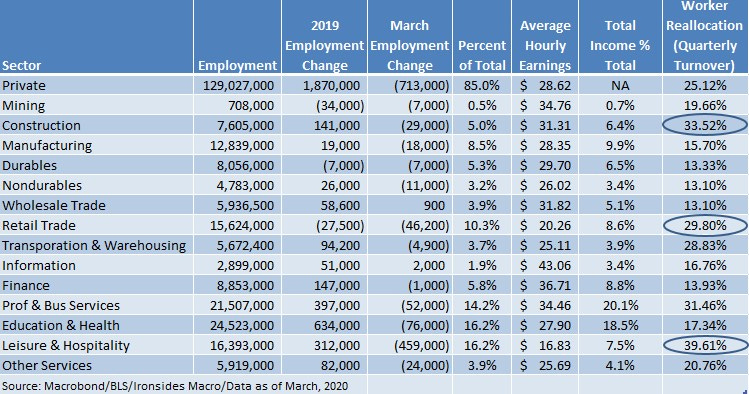
Figure 3: Worker reallocation is the quarterly sum of hiring and separations; both voluntary quits and involuntary layoffs. Yes you are reading this correctly, 25% of the labor force turned over in the 3 months ended February, before governors shut down a large portion of economic activity.
Barry C. Knapp
Managing Partner
Ironsides Macroeconomics LLC
908-821-7584
https://ironsidesmacro.substack.com
https://www.linkedin.com/in/barry-c-knapp/
@barryknapp
This institutional communication has been prepared by Ironsides Macroeconomics LLC (“Ironsides Macroeconomics”) for your informational purposes only. This material is for illustration and discussion purposes only and are not intended to be, nor should they be construed as financial, legal, tax or investment advice and do not constitute an opinion or recommendation by Ironsides Macroeconomics. You should consult appropriate advisors concerning such matters. This material presents information through the date indicated, is only a guide to the author’s current expectations and is subject to revision by the author, though the author is under no obligation to do so. This material may contain commentary on: broad-based indices; economic, political, or market conditions; particular types of securities; and/or technical analysis concerning the demand and supply for a sector, index or industry based on trading volume and price. The views expressed herein are solely those of the author. This material should not be construed as a recommendation, or advice or an offer or solicitation with respect to the purchase or sale of any investment. The information in this report is not intended to provide a basis on which you could make an investment decision on any particular security or its issuer. This material is for sophisticated investors only. This document is intended for the recipient only and is not for distribution to anyone else or to the general public.
Certain information has been provided by and/or is based on third party sources and, although such information is believed to be reliable, no representation is made is made with respect to the accuracy, completeness or timeliness of such information. This information may be subject to change without notice. Ironsides Macroeconomics undertakes no obligation to maintain or update this material based on subsequent information and events or to provide you with any additional or supplemental information or any update to or correction of the information contained herein. Ironsides Macroeconomics, its officers, employees, affiliates and partners shall not be liable to any person in any way whatsoever for any losses, costs, or claims for your reliance on this material. Nothing herein is, or shall be relied on as, a promise or representation as to future performance. PAST PERFORMANCE IS NOT INDICATIVE OF FUTURE RESULTS.
Opinions expressed in this material may differ or be contrary to opinions expressed, or actions taken, by Ironsides Macroeconomics or its affiliates, or their respective officers, directors, or employees. In addition, any opinions and assumptions expressed herein are made as of the date of this communication and are subject to change and/or withdrawal without notice. Ironsides Macroeconomics or its affiliates may have positions in financial instruments mentioned, may have acquired such positions at prices no longer available, and may have interests different from or adverse to your interests or inconsistent with the advice herein. Ironsides Macroeconomics or its affiliates may advise issuers of financial instruments mentioned. No liability is accepted by Ironsides Macroeconomics, its officers, employees, affiliates or partners for any losses that may arise from any use of the information contained herein.
Any financial instruments mentioned herein are speculative in nature and may involve risk to principal and interest. Any prices or levels shown are either historical or purely indicative. This material does not take into account the particular investment objectives or financial circumstances, objectives or needs of any specific investor, and are not intended as recommendations of particular securities, investment products, or other financial products or strategies to particular clients. Securities, investment products, other financial products or strategies discussed herein may not be suitable for all investors. The recipient of this report must make its own independent decisions regarding any securities, investment products or other financial products mentioned herein.
The material should not be provided to any person in a jurisdiction where its provision or use would be contrary to local laws, rules or regulations. This material is not to be reproduced or redistributed to any other person or published in whole or in part for any purpose absent the written consent of Ironsides Macroeconomics.
© 2020 Ironsides Macroeconomics LLC.