Productivity Boom: Cyclical or Secular?
Peak Interventionism, Payroll Shocker, Productivity Boom, Reducing Intermediate Treasuries
We are removing the paywall on this week’s note to our large list of subscribers to the abbreviated introductory notes and audio/video summaries, to offer a glimpse of what full subscribers receive at least once a week.
The Growth Scare Window is Closing Fast
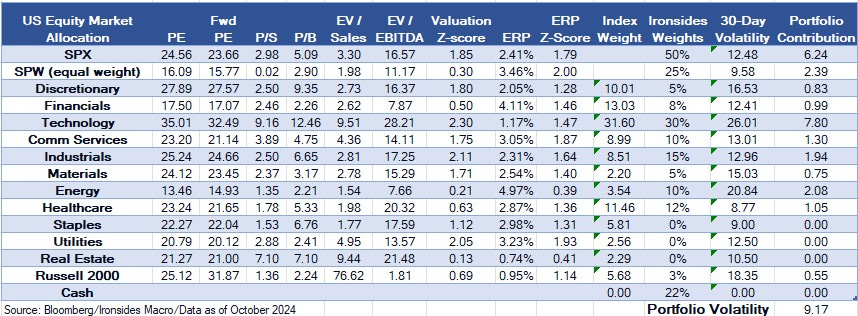
In this week’s note we are going to discuss our outlook for the final quarter in what has been a stellar year for equities, particularly if you are a passive or technology sector investor. For our part, we have had a decent year in our US equity model portfolio. We have maintained our market weight in technology and communication services, the two largest sectors in our benchmark S&P 500 index. Our largest overweight in absolute and relative terms, industrials hasn’t kept up with the index but is up a strong 18%. Our overweights in energy and materials have been a drag on performance, but they are small sectors, and 11-12% price returns are respectable. We began the year with an underweight in financials but added exposure in the spring after the administration’s capital proposal lost momentum. Our biggest miss has been the utilities sector, while it is a small sector, it is the best performer of the year. We have maintained a negative view on small caps and small banks throughout 2024 due to our view that the deeply inverted 3m10y Treasury curve resulting from the FOMC’s passive QT and aggressive rate hiking cycle created excessively restrictive credit conditions for floating rate borrowers. We maintained a healthy cash position, but the above market volatility of our sector exposures offset the cash drag, to some extent. We are leaning a bit more long into the final quarter by reducing our fixed income and adding international equities.
Our positioning is intended to capitalize on a broad macro theme; a strong capital investment cycle and accelerated technology innovation adoption driving faster productivity growth than the ‘10s. We are expressing our productivity boom thesis by investing in technology producers, the US manufacturing renaissance and energy required to power the technology and the industrial renaissance. We expect the diffusion of technology innovation adoption to more consumer services companies and increasingly, financial, healthcare and industrial companies. While this all sounds bullish, fiscal and monetary policy intervention in the spontaneous economic order is at levels with only one precedent, World War II. Throughout 2024 we have been debating the battle of private sector productivity and public sector interventionism, the markets message is that the private sector is winning the fight. We will begin the note with a discussion of peak policy interventionism before moving to increasing evidence of stronger productivity growth.
Thursday’s September ISM Services Survey was a microcosm of the prevailing economic narrative that although demand for labor is cooling, it hasn’t weakened to levels that are impacting consumer spending. The composite index increased from 51.5 to 54.9, business activity, new orders and prices paid were close to 60, but employment fell to 48.1 from 50.2. We’ve written extensively about the Fed’s balance sheet accommodative balance sheet channels; liquidity (excessive reserves), duration (rate suppression) and volatility (mortgage prepayment interest rate risk). Fiscal policy, 7% deficits and record non-recessionary or wartime spending relative to GDP, is stimulative as well. Rate policy is restrictive, but only for floating rate borrowers, generally small companies, the part of the economy with the least visibility. Consequently, with manufacturing, housing, capital investment, small businesses and demand for labor all weak, accommodative policy support for consumption makes for an unstable equilibrium. The market expects the FOMC to reduce the policy rate to 3% by year-end ‘25, presidential candidates are promising increased tax expenditures on top of the record levels of spending despite two warnings shocks in the Treasury market in 1Q21 and 3Q23, and valuation of both stocks and Treasuries are elevated, what could go wrong? After Friday’s employment report, it appears that nothing is likely to go wrong enough to derail the equity market rally, but the outlook for Treasuries is deteriorating quickly.
In this week’s note, in addition to discussing the battle of the private sector productivity boom and public sector policy bust, we cover our expectations for markets for the final stretch of 2024, review the employment report, and reveal our election outcome forecast.
Interventionism Denouement
The clash of the productivity boom and policy bust is about to reach its denouement; both presidential candidates are proposing additional spending, either direct government expenditures or tax expenditures for favored sectors or groups, despite government spending at 24% of GDP and projected by the Congressional Budget Office to remain at that level for the next 10 years, 3.5% above the median since 1980. Pre-pandemic spending, from the passage of the 2011 Budget Control Act that capped spending growth at 2%, averaged 20.3%. The pandemic policy panic lifted spending to 30% in ‘20 under the Trump Administration and ‘21 under the Biden Administration. The Biden Administration’s industrial policy and 1.1% expansion of direct transfer payments to individuals as a percent of disposable income capitulated government spending to a higher inflationary plateau of 24% as far as the CBO’s eyes can see. Evidence of the impact of deficits and industrial policy increasing inflation include construction and manufacturing wage growth 1% faster than service providing industries despite both the ISM Manufacturing Survey in contraction every month except one for two years and housing starts 26% below the post-pandemic peak. Additionally, government employment annualized growth of 2.26% is 1.44% above our adjusted private sector estimate (extrapolating the benchmark revision) and the employment cost index for government employees is 1% above the private sector. Typically, government employment and wage growth only exceeds the private sector during the fiscal policy response to recessions.
The much larger role for monetary policy in the capital allocation process began earlier when the Fed abandoned the bills only balance sheet policy during the financial crisis (QE1) that began with the Fed/Treasury Accord of 1951 that ended the World War II Treasury yield caps intended to facilitate the financing of the war. Low and stable inflation in the ‘50s and early ‘60s was considered a goal by a Federal Reserve dominated by bankers. In the ‘10s, obsession with Great Depression deflation following the financial crisis by a Fed dominated by Schumpeterian elite technocrats, led to far more activist policy. The result was negative real (inflation adjusted) policy rate for the entire decade-long business cycle and a collapse in the premium of 10-year Treasury yields over consumer price inflation. Like fiscal policy, the pandemic was an accelerant to monetary policy’s interventionism. The Fed’s balance sheet relative to GDP was 6% in the ‘00s, it peaked at 25% in 2014, contracted to 18% when QT1 ended in 2019, exploded to 37% at year-end 2021 and is currently 25%. Importantly, the duration is ~6 years, the Kansas City Fed staff estimates the stock of holdings is suppressing nominal 10-year yields by over 1%. In addition, the financial crisis ‘run on repo’, repo rate spike in September ‘19, and dash for cash in February 2020 were catalysts for the Federal Reserve to move from a scare reserve regime where interbank lending dominating the overnight money market, to an abundant (excessive) reserve regime where the Fed plays the dominant role. In short, the Fed’s role expanded sharply in short term money markets and even more importantly in our view, longer term rates that are integral to the capital allocation process. Friedman, Hayek and perhaps even Keynes are rolling over in their graves.

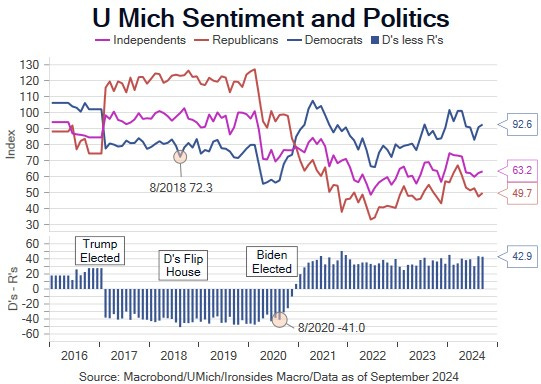
Most of the analysis of the implications of the presidential election assume fiscal policy will continue down the same path, and to be sure campaign rhetoric supports that outcome. There has been little discussion of the role of the Federal Reserve other than a discussion of Fed independence. We are increasingly convinced of a couple of dynamics that will alter the interventionist fiscal and monetary policy path. First, we now expect former President Trump to be reelected. The momentum of the Harris campaign in swing state polls following the debate appears to have stalled. The University of Michigan Consumer Sentiment Survey suggests the upside-down right track/wrong polls are being driven by Republicans and the crucial independent voters. We suspect the small group of undecided voters will break for Trump and it is his race to lose. The Senate appears highly likely to flip and most political analysts expect the House to follow the top of the ticket. Consequently, the most probable outcome is a GOP sweep. While the GOP is not the party of Reagan, we expect a revival of inflation in 2025 that will strengthen the position of GOP budget hawks and is likely to trigger a reduction in spending, but only after a new high for Treasury yields above the ‘23 5% peak.
Second, although the administration cannot make immediate changes to the board of the FOMC, there will be a new Chair in 2026 who will push to reduce the size and duration of the balance sheet and smaller role for monetary policy. In other words, we expect peak interventionism, but not before we have our third major Treasury market disruption event, like the sharp increases in longer maturity real rates in 1Q21 and 3Q23, following the election into early ‘25, that signals the US is approaching its fiscal limit. The bond vigilantes ran for cover for two decades during globalization foreign currency reserve manager and Federal reserve price insensitive Treasury buying, but as the private sector regains control over price setting, rationality will return.
One final thought, if Vice President Harris is elected a bond market impulsive correction that forces fiscal contraction is just as probable, however the policy response is likely to decidedly different. First, the tax hikes are likely to be combined with more modest spending cuts. Additionally, Treasury issuance and monetary policy (financial repression) will be part of the response. Finally, monetary policy is likely to remain interventionist, in other words, a return to QE.
Payrolls, Holy Cow!
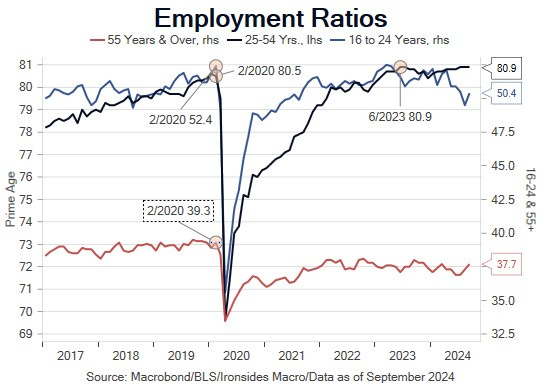
Bloomberg’s lead economics reporter Mike McKee quoted the Scooter Phil Rizzuto with respect to the September employment report, and we agree, ‘holy cow’ was also our reaction to the drop in the unemployment rate to 4.051%, the 223,000 increase in nonfarm payrolls, 0.4% increase in average hourly earnings and a 72,000 positive revision to the prior two months. While the primary headline numbers were strong, the work week declined to 34.2, below last cycle’s low leading the broadest measure of demand for labor, the aggregate hours index to drop 0.1% on the month leading to a flat reading for the quarter. Labor income, hours worked multiplied by average hourly earnings, cooled from 5.16% to 4.84%, close to the 2H19 average monthly rate of 4.68%. We suspect the report is a something of a statistical fabrication, the employment ratios appear to have been distorted by seasonal adjustment factors. The prime age employment ratio was unchanged at the cycle high of 80.9%, however the 16-24 age cohort jumped sharply to 50.4% vs 49.5% following a persistent decline throughout ‘24 and the 55+ age group increased to 37.7% vs 37.3%, a level that was 2% below the pre-pandemic rate. We suspect the increase in the 16-24 cohort was a residual of the pandemic school and accommodation closings polluting seasonal adjustment factors in the month when students go back to school. We doubt there was a surge in employment for younger and older workers, the September Challenger report showed slower seasonal hiring this year from a year ago and well below the pre-pandemic rate.
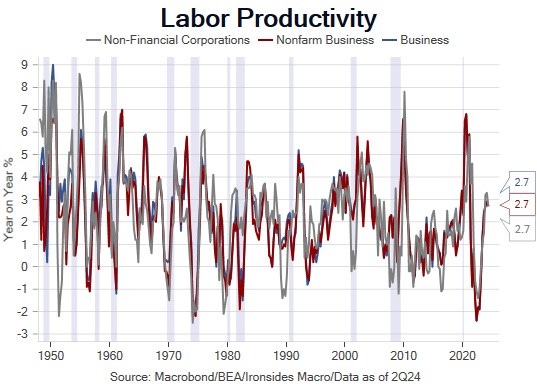
While we suspect this report was a statistical aberration that will reverse next month, the narrative that the labor market is normalizing rather than deteriorating and we are in a productivity boom is likely to persist at least until the next report. An approach to estimating economic output is total hours worked plus productivity growth equals output (GDP/GDI). The Atlanta Fed GDP Now 3Q24 tracking estimate at 2.5% and the aggregate hours index quarterly annualized change at zero implies 2.5% productivity growth. From the FOMC’s perspective we discussed in our payrolls preview note, wage growth less productivity equals consumer price inflation. That simplified inflation model suggests 4% average hourly earnings growth (3.94% for the cleaner production & nonsupervisory series), and 2.5% productivity growth should generate below target inflation of 1.5%. Although productivity is the most important and most difficult to measure economic variable, consequently, it is the variable the FOMC has the least confidence basing policy action on, the case that productivity growth is considerably faster this cycle is strengthening. The productivity surge suggests Larry Summer’s assertion that the FOMC made a mistake cutting 50bp in September is wrong. The FOMC did not have the strong GDI revision or September employment report in hand when they cut 50bp, however, even if they did the cut was justified in our view due to the imbalance it is creating between small and large businesses as well as stronger productivity growth. The surge in productivity creates space for the FOMC to cut further, however, it also suggests the terminal rate is closer to 4% rather than the market’s expectation of a 3% policy rate at year-end ‘25.
Earnings & Productivity
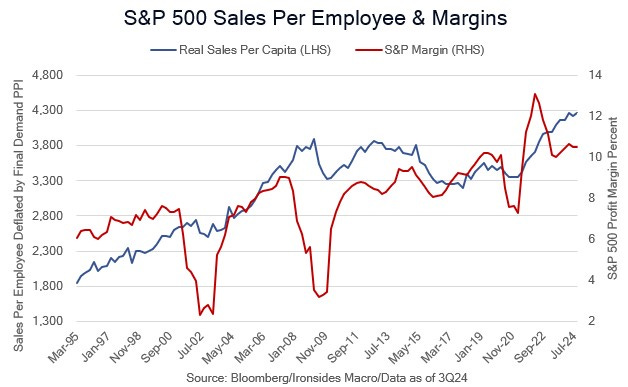
Our ‘micro to macro’ approach to measure productivity using corporate data is to use sales per employee deflated using the producer price index. We suspect there is plenty of noise in this data, however, the aggregate data and strengthening trends in consumer discretionary, financial, technology and health care sectors is consistent with our thesis that accelerated technology innovation adoption late last cycle (‘18-’19) is spreading to additional sectors, in part due to pandemic policy restrictions turbocharging the process. We will be watching these numbers through earnings season and will look at additional approaches to deflate the data.
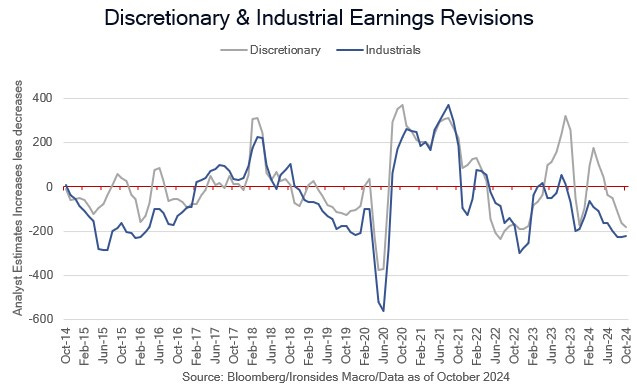
Despite our optimistic productivity outlook, it remains possible that the current strength is the lagged effect of the mid-’21 to mid-’22 Great Reallocation as workers hit their peak level of performance just before the inevitable grumbling at the water cooler ‘this job sucks and I hate my boss’. All kidding aside, our sector net revisions measures are still negative for cyclical sectors a week ahead of the beginning of earnings season. We expect 4Q estimates to get marked down, but given the run of stronger macro reports, CEOs and CFOs might be more optimistic than would have been the case if the unemployment rate had ticked up as we expected, and GDP was decelerating.
Sell Treasuries
The window for a growth scare driven correction in US equities ahead of 4Q favorable seasonality is closing rapidly. Earnings season beginning Friday might be the last chance for a pullback pre-election. Generally, elections breed optimism, consequently, with the exception of a Democratic Party sweep or a contested election equities will likely rally, and Treasuries sell off under most of the likely outcomes. We added 2.5% positions to Japanese and Emerging Market equities, funded out of our intermediate fixed income position.
The energy sector had a big rally this week. In our view a Trump Administration will have a larger impact on energy infrastructure (pipelines, LNG export terminals, etc.) than total production. To be sure, opening federal lands prohibited by the Biden Administration will create more drilling options, but that is more likely to reduce costs and improve efficiency than increase total production. The market will determine output. The sector remains attractive.
Sector and Asset Allocation Tables Explained:
The US Equity Market Allocation table is our recommendations for a US equity investor, a similar approach to when we were the Head of Barclays US Equity Portfolio Strategy. The first six columns are valuation metrics, the seven is a Z-Score summary of the metrics relative to each sector’s valuation range since S&P introduced each sector (1990 for all but Real Estate). A reading of 1 implies the sector is 1 standard deviation above its historical median. The equity risk premium (ERP) column, also known as the Fed Model, is the forward (expected) earnings yield less the real 10-year yield (TIPS). Index weights are the S&P 500 with the exception of the Russell 200 small cap index, that is based on the market cap of the Russell 2000 relative to the Russell 3000. The final three columns are the Ironsides recommended weight, the 30-day volatility of the sector and portfolio contribution of our recommended weights to the risk (volatility) of the portfolio. Importantly, this approach does not integrate cross correlation of the sectors.
The asset allocation table benchmark is a 60/40 (stocks/bonds) portfolio, under the assumption that the investor is investing US dollars. We begin with our recommended weights, add the yield, the third columns are valuation metrics. ERP is the equity risk premium. TP is the term premium for Treasuries using the Adrian Crump & Moench model from Bloomberg. OAS is the option adjusted spread (early call risk) for fixed income securities. ‘SD’s’ from the median is a Z-Score approach to the valuation metrics, positive readings imply the asset is expensive, negative readings imply the asset’s valuation is below its longer-run median. The sixth column is the assets contribution to the risk of the portfolio, its volatility multiplied by the recommended weight of the asset. The index weights for equities use the same approach as the equity only portfolio, the fixed income weights are based on the Bloomberg US Aggregate Index, adjusted for the 60/40 benchmark. The final two columns are self-explanatory.
Barry C. Knapp
Managing Partner
Director of Research
Ironsides Macroeconomics LLC
908-821-7584
bcknapp@ironsidesmacro.com
https://www.linkedin.com/in/barry-c-knapp/
@barryknapp


