

Risk Reduction
This week's inflation reports are primarily an issue for profit margins, like tariffs in '25.

In this week’s note we review ‘inflation week’, dive deep into the outlook for Treasuries and implications for equities:
The recent spikes in CPI, PPI, and import prices do not signal lasting inflation. Instead, higher energy prices and past tariffs appear to be squeezing profit margins and weakening demand, which can be disinflationary rather than inflationary. The energy price spike is likely to impact margins, rather than get passed through to consumer prices, however this is bad news for economically sensitive equity sectors.
Goods Disinflation and Pass-Through: Data shows core goods prices decelerated significantly just months after peak tariff rates, debunking "free trader" warnings of persistent pipeline inflation. Similarly, the impact of higher energy prices is proving disinflationary for consumers, as evidenced by a sharp drop in nominal retail sales for categories like apparel.
Fed Policy and Leadership Transition: With Kevin Warsh succeeding Jerome Powell, the Fed faces a transition toward supply-side focus, though it must navigate internal resistance to reducing the Fed’s footprint, a process we are referring to as privatization of the balance sheet.
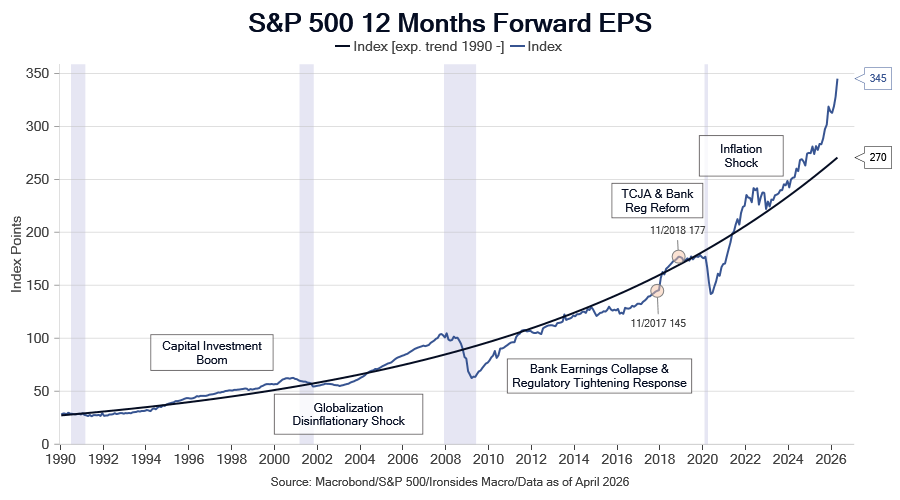
While 10-year yields around 4.6% are elevated, the level is not exceptional relative to the ‘90s or ‘00s, consequently, the level of rates is not terminal to our capex boom outlook so long as real rates stay near 2% and do not surge toward prior peaks. Our tactical concern is that the path to meaningfully lower long-term yields is narrow because of government spending driven deficits, the energy price spike driven delay in the Bessent/Warsh/Bowman Fed balance sheet privatization, and global bond-market pressures.
We have been underweight fixed income since the 39-year bond bull market ended in August 2020, consequently due to our secular bearish outlook we are not tempted to fade the selloff in longer maturity USTs. Because we expect the energy price spike to pressure profit margins, and stabilization in the Treasury market might require weaker growth and employment, we are reducing risk in economically sensitive equities and increasing exposure to short-term Treasuries and cash.
Note: With a delay, the paywall is being removed, and the note will be emailed to all introductory subscribers as we do periodically to provide a sample of what you could receive for supporting our work.
The Tariff Inflation Dog Didn’t Bite, Is it Different This Year?
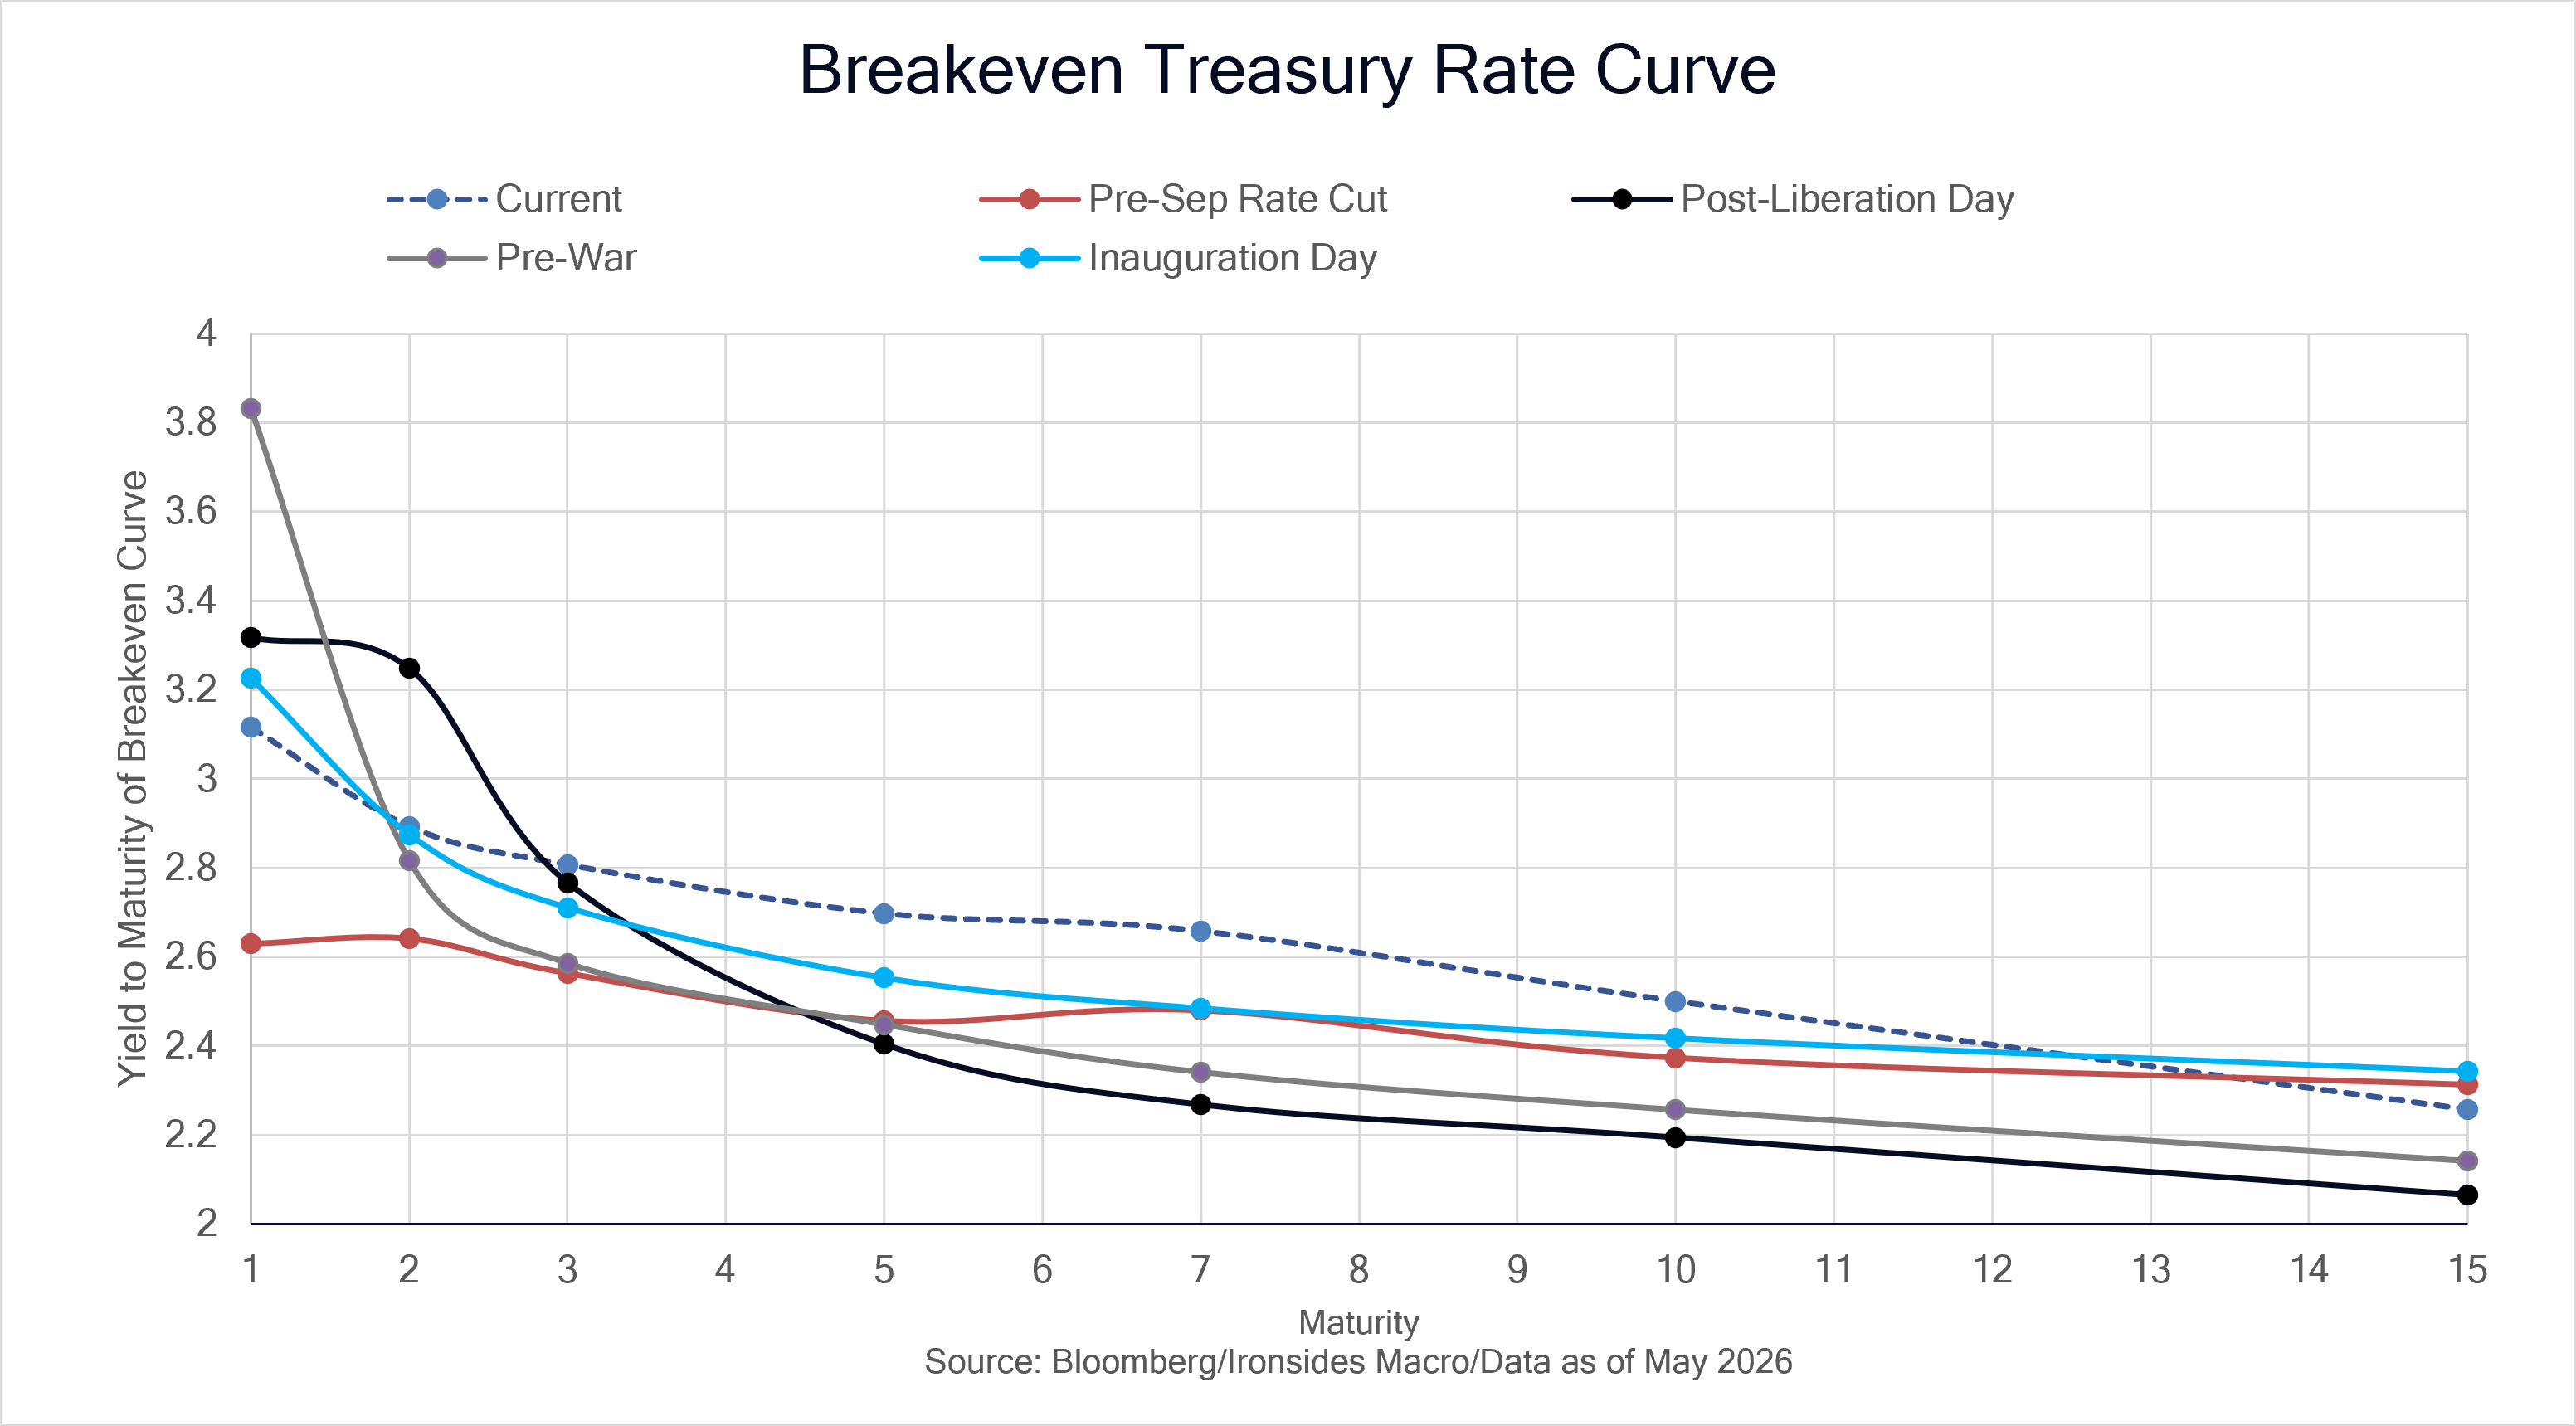
Following the hotter than expected April Consumer Price Index report Tuesday and the red-hot April Producer Price Index release Wednesday, 10-year Treasuries touched 4.5%, but then curiously found buyers despite an auction of $25 billion of 30-year bonds above 5% and a hot April Import Price Index report the following morning. We agree with the market’s ‘suggestion’ that headline inflation is peaking, but Friday’s real rate spike was more concerning for risky assets broadly and US equities specifically. Before we dig into the details, we want to reiterate the dichotomy between our ‘26 and longer run secular outlooks. Trend inflation is not 2% in the US, the 2% Fed target, adopted during the post-financial crisis debt deflation and Chinese goods deflationary impulse, is an unrealistic objective. Consequently, periods when inflation reaches the Fed’s target are likely to be transitory, mostly attributable to recessions. The message from the markets this week, disinversion of the breakeven inflation curve (lower inflation in the future), flattening of the real rate (TIPS) curve (weaker near term growth), and weakness in the consumer discretionary and financial sectors, small and midcaps, as well as equal-weighted S&P 500, suggest the energy price spike, like the Trump tariffs, is likely to compress profit margins and reduce consumption, not increase the rate of inflation. We think the markets are getting the outlook correct.
Heading into the tariff shock in ‘25 we were bearish, we caught the low then remained bullish throughout ‘25. In ‘26, we were again looking for an equity market pullback due to our expectations that supply and stronger growth would increase real rates, we got a 9% correction but find ourselves less bullish than we were at this point a year, in part because our monetary and fiscal policy outlooks are not as favorable.
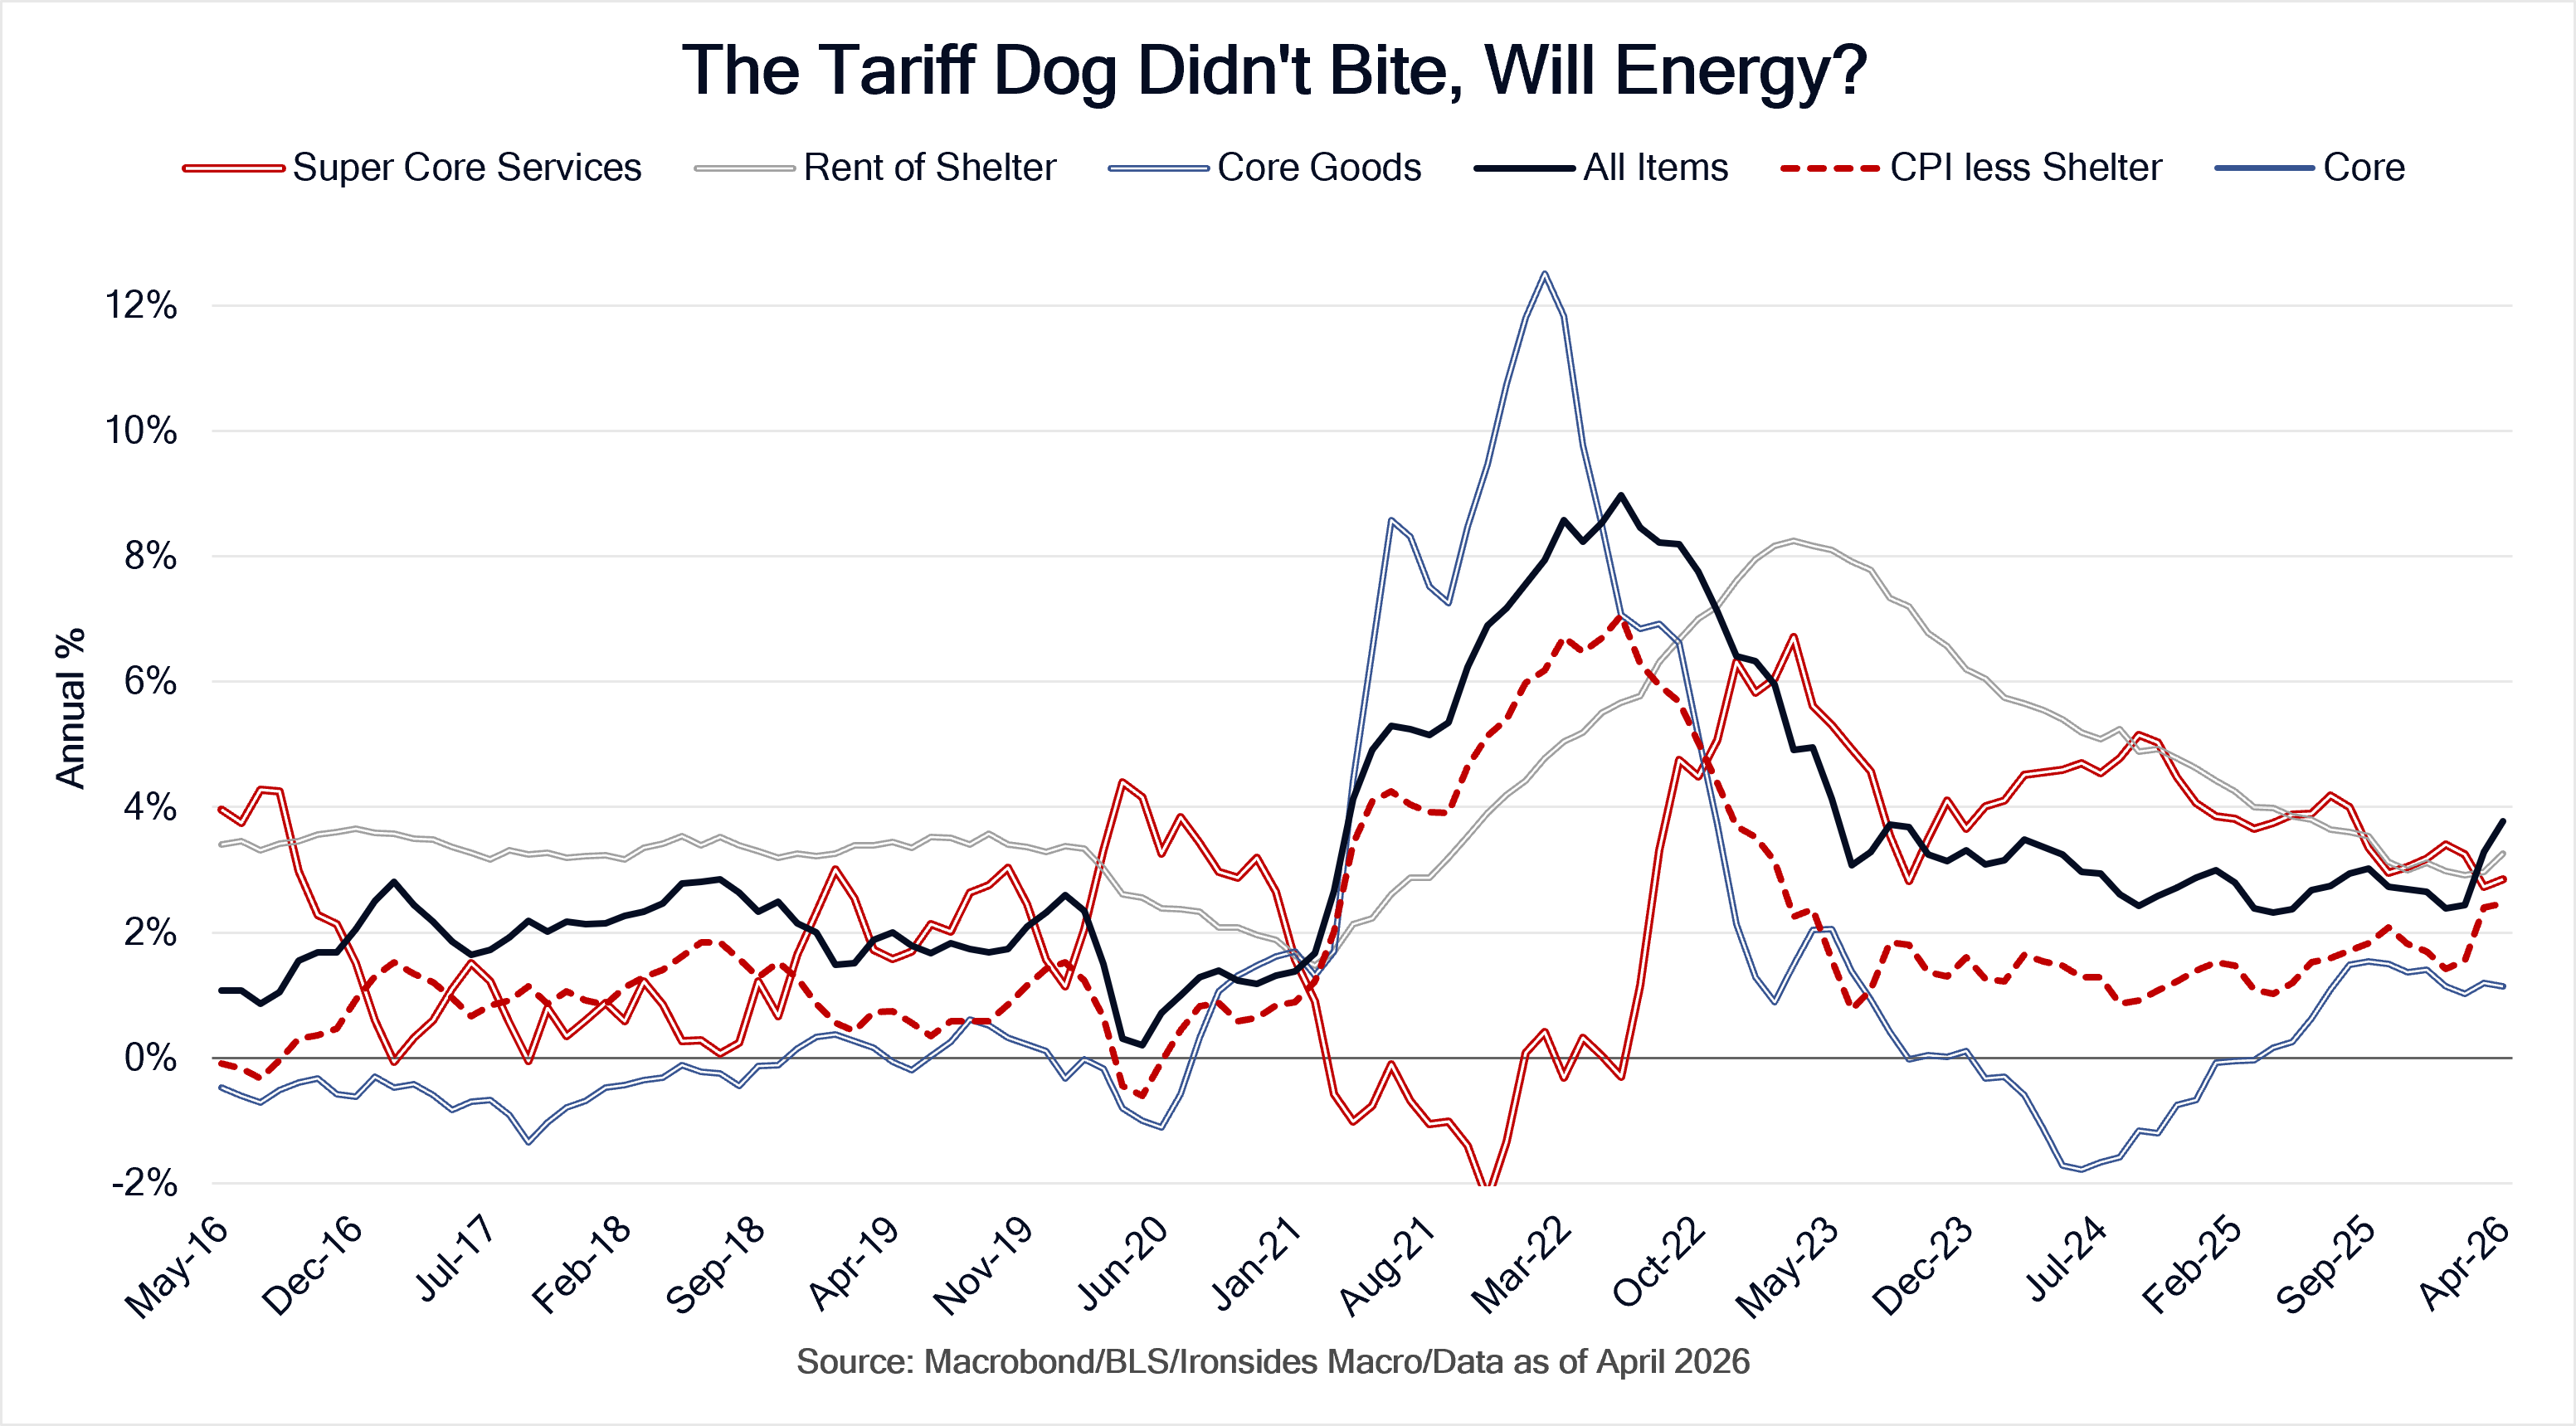
The April CPI report, rounded to one decimal, appeared to be an upside surprise for the ex-food & energy ‘core’ rate at 0.4%, however there was less here than meets the eye (0.38%, 0.05% above consensus). Core goods prices increased 0.03% from March, since September, the month before the peak in the effective tariff rate, there has not been a 0.2% monthly increase with a median of 0.03%. The 6-month annualized rate is 0.71%, down from a peak of 1.75% in September, the year-on-year rate is 1.14% from a peak of 1.54% also in September. This is significant given the peak in the effective rate was September and October, yet goods price inflation decelerated with an inconsequential lag. Remember all the ‘free traders’ warnings that tariff inflation was in the pipeline. Meanwhile, the profit margin on the staples sector hit its lowest level in decades during 3Q25. Goods prices are where we would expect to see energy price pass through, however, like tariffs the impact is looking disinflationary. One category we heard highlighted on financial television was the 0.6% increase in apparel prices, what we didn’t hear was the same journalists noting the 1.5% monthly drop in clothing in the April Retail Sales report. Given that the Commerce Department Retail Sales series is nominal prices (not inflation adjusted), the impact of higher gasoline prices and importers attempts to charge consumers higher prices for clothing, was a sharp drop in sales. One final note, we’ve been referring to this category as core goods, BLS calls it commodities ex-food& energy.
Chicago Fed President Goolsbee on television immediately following the report raised concerns about services inflation, an assessment we disagree with. Neither BLS (CPI) nor BEA (PCED) produce a metric for non-housing, ex-energy services inflation. Following former Chairman Powell’s November ‘22 Brookings Institute inflation speech, we created this metric by subtracting energy services inflation from the BLS CPI Services less Rent of Shelter special series. In April their measure increased 0.38%, but after subtracting the 1.62% monthly increase in energy services we got 0.18% for core non-housing services for the month and an annualized rate of 2.85%. The annualized rate is above the pre-pandemic trend, however, that is primarily attributable to yet another example of pandemic seasonal adjustment factor distortions that boosted the last three months. In short, higher energy prices already may be putting pressure on services prices.
The upside surprise in Core CPI was attributable to a 0.63% increase in rent of shelter. This was not because rents increased, instead it was a residual of the treatment of rents during the government shutdown. BLS smooths rents over a 6-month period, in October they ‘plugged’ in no change, consequently this was a base effect. We remain convinced the BLS rent of shelter, and BEA equivalent, are headed to 2% later this year and here is why. In December 2019, pre-pandemic, the Apartment List New Rents Index year-on-year rate was 2.49%, the Zillow Observed Index was 3.96%, CPI Rent of Shelter was 3.29% and PCED rent of Tenant-Occupied Index was 3.70%. During 2018 and 2019 these measures were close, Apartment List was generally below, and Zillow was mostly above the government measures. In March ‘26 Apartment List was -1.59% and Zillow was 1.84%, while BLS has not yet released its 1Q26 New Tenant Rent Index, in 4Q25 it was 1.26%. The BLS and BEA measures of rents are headed lower; the only obstacle is the lag impaired construction that renders them close to useless in real team and perhaps even deleterious due to FOMC ‘data dependency’.
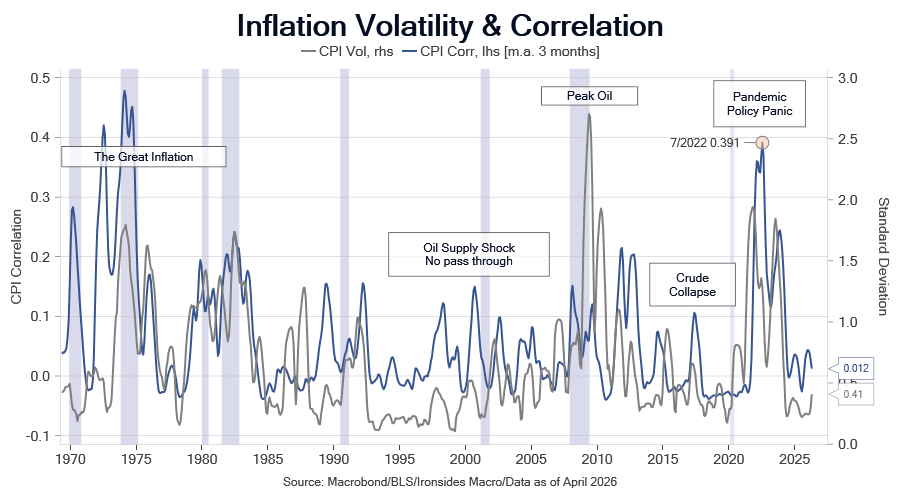
One final note on the CPI report, the sharp increases in food and energy in March and April increased the annual standard deviation of all items CPI from 0.25% in February to 0.41%. Increases in inflation volatility are destabilizing, price stability was a key factor in the ‘60s and ‘90s capital spending booms. That said, the median for this measure of price stability since 1947 when BLS reported CPI monthly is 0.58%. Additionally, like the largely forgotten 1999-2000 near tripling of the price of crude or the 2008 spike, correlation is falling, unlike the ‘70s, suggesting the risk of pass-through to core inflation is low.
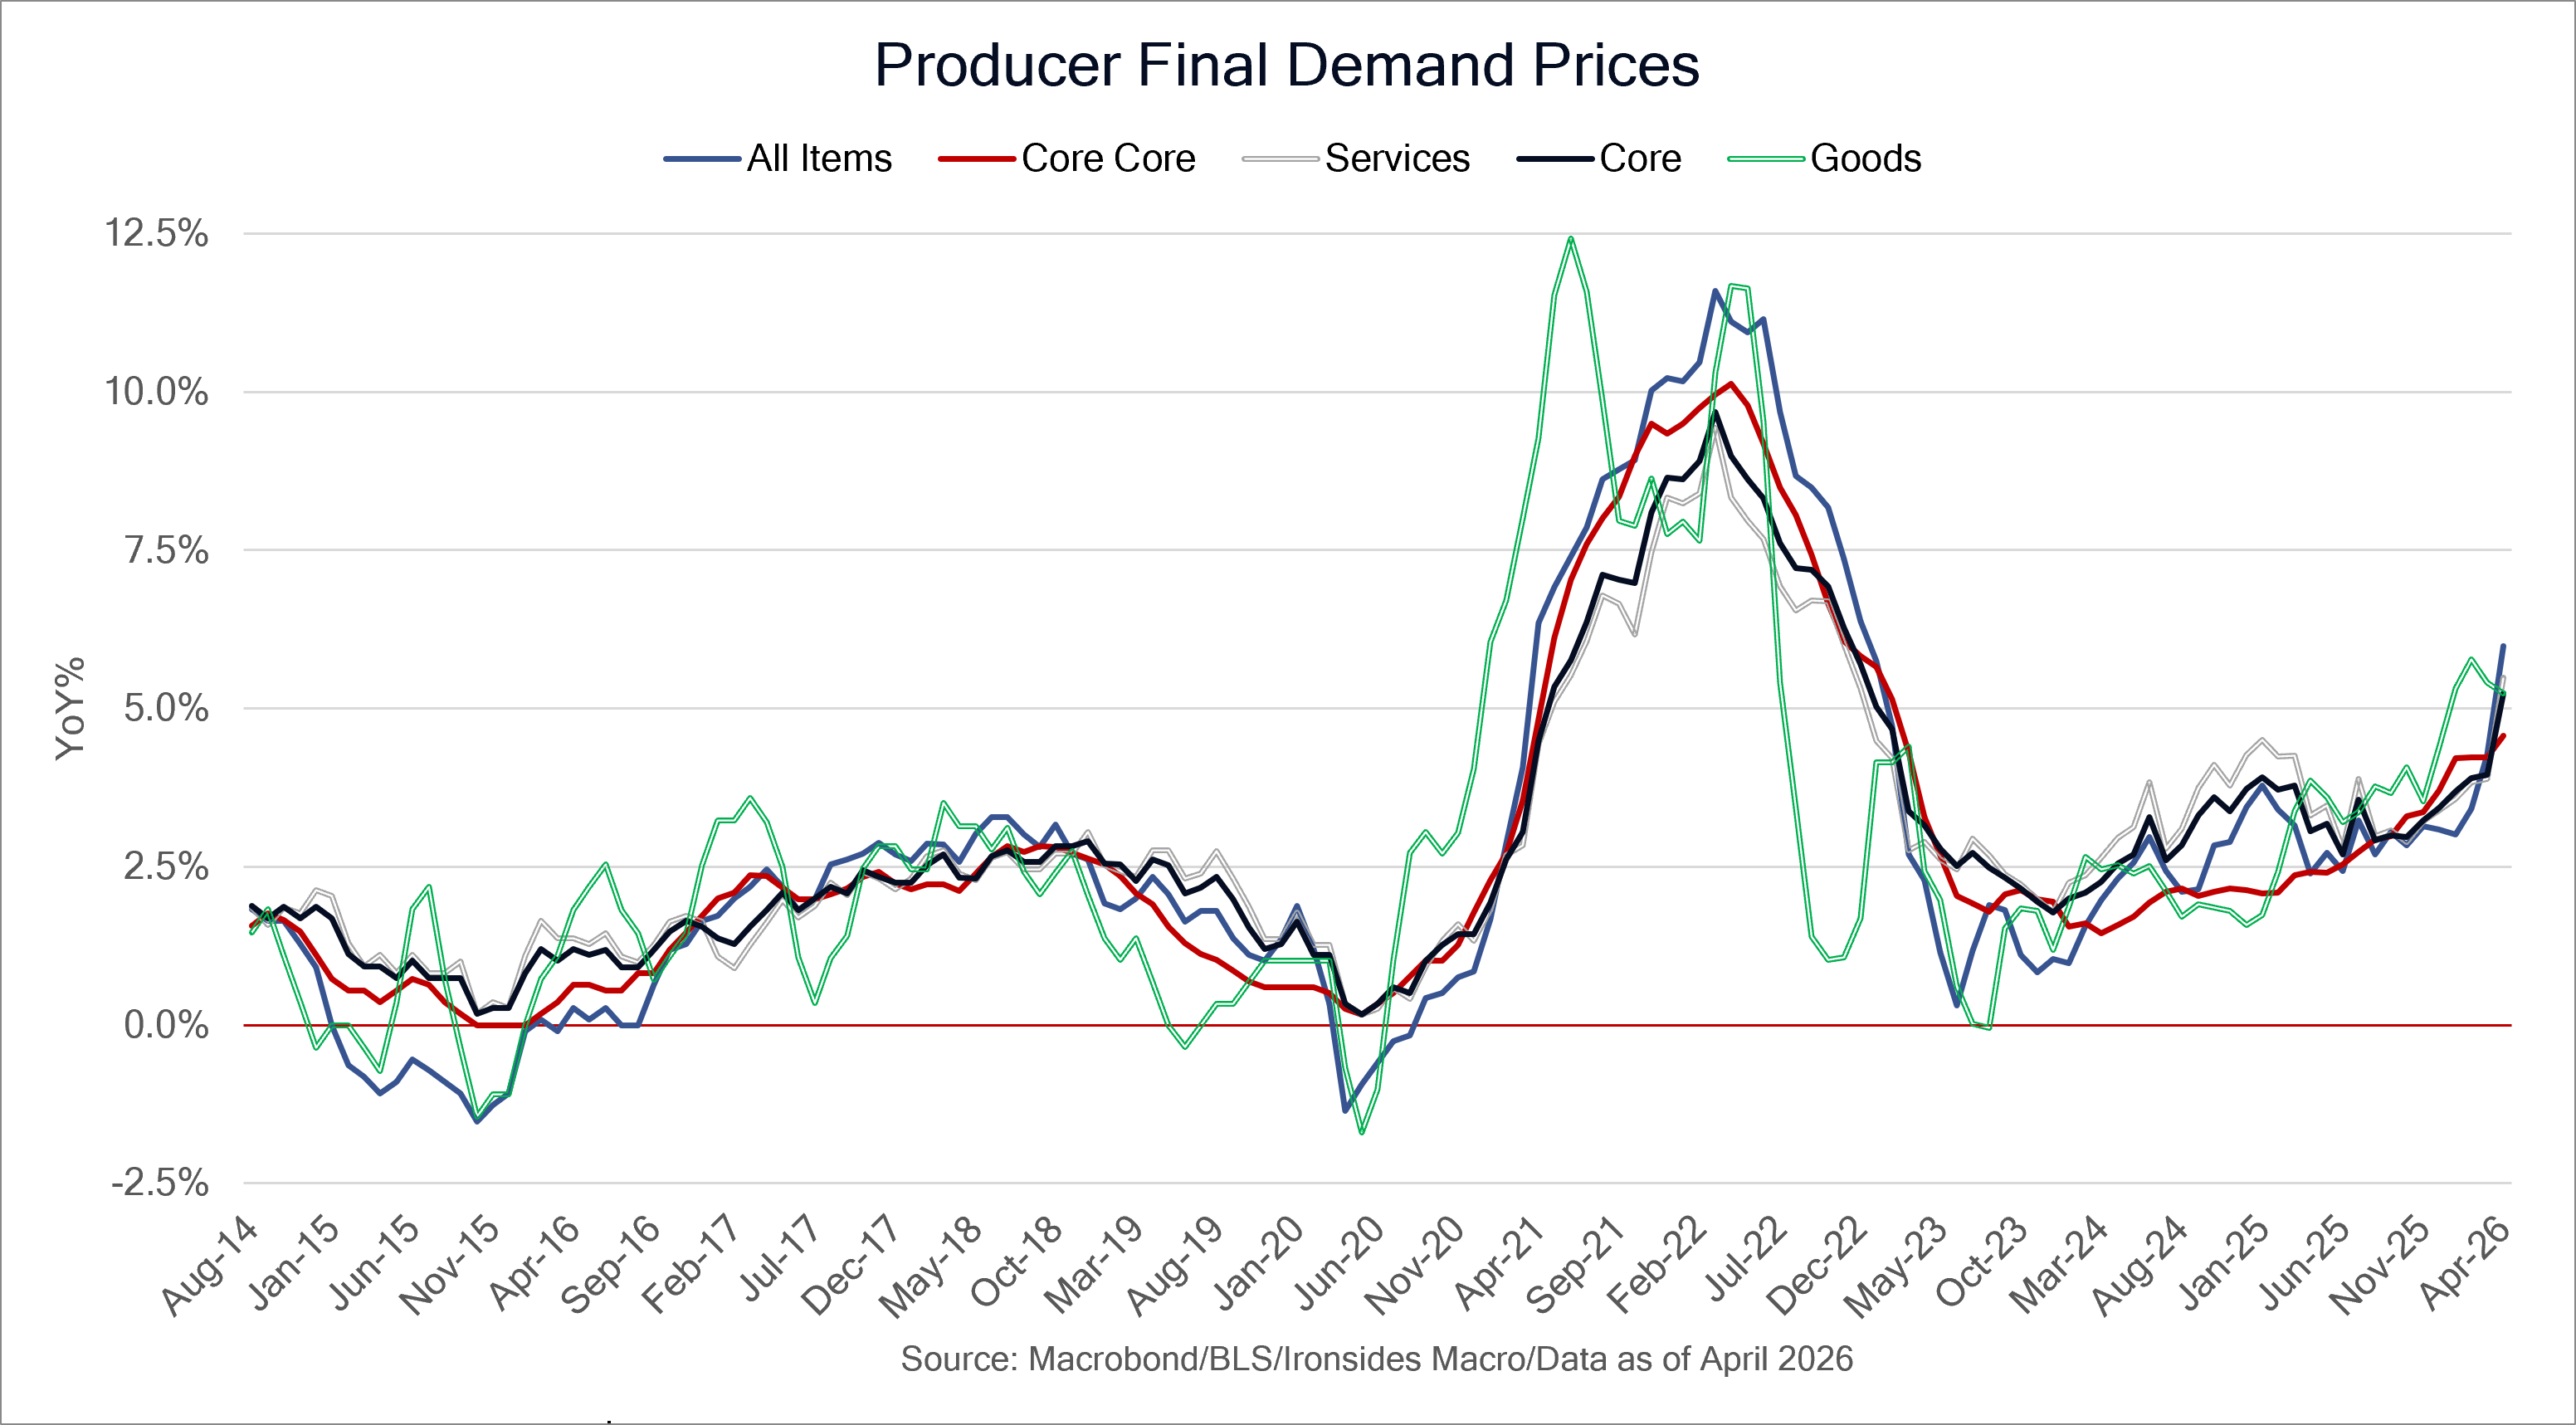
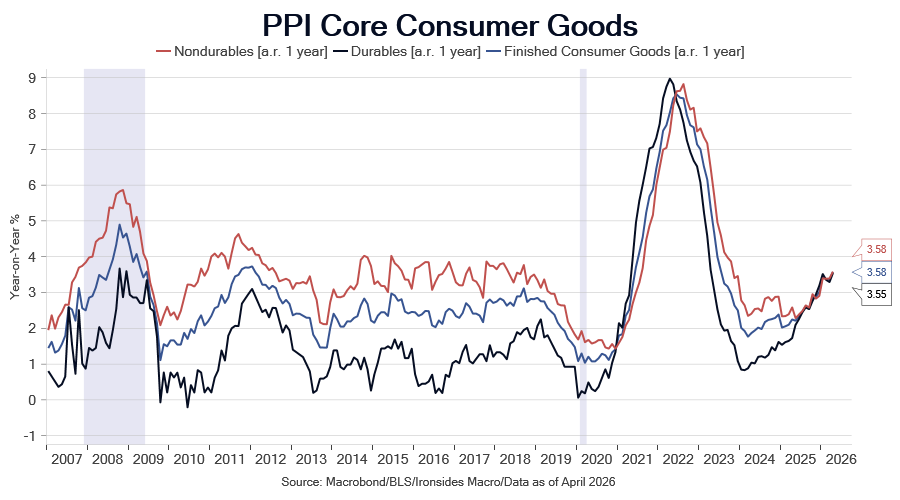
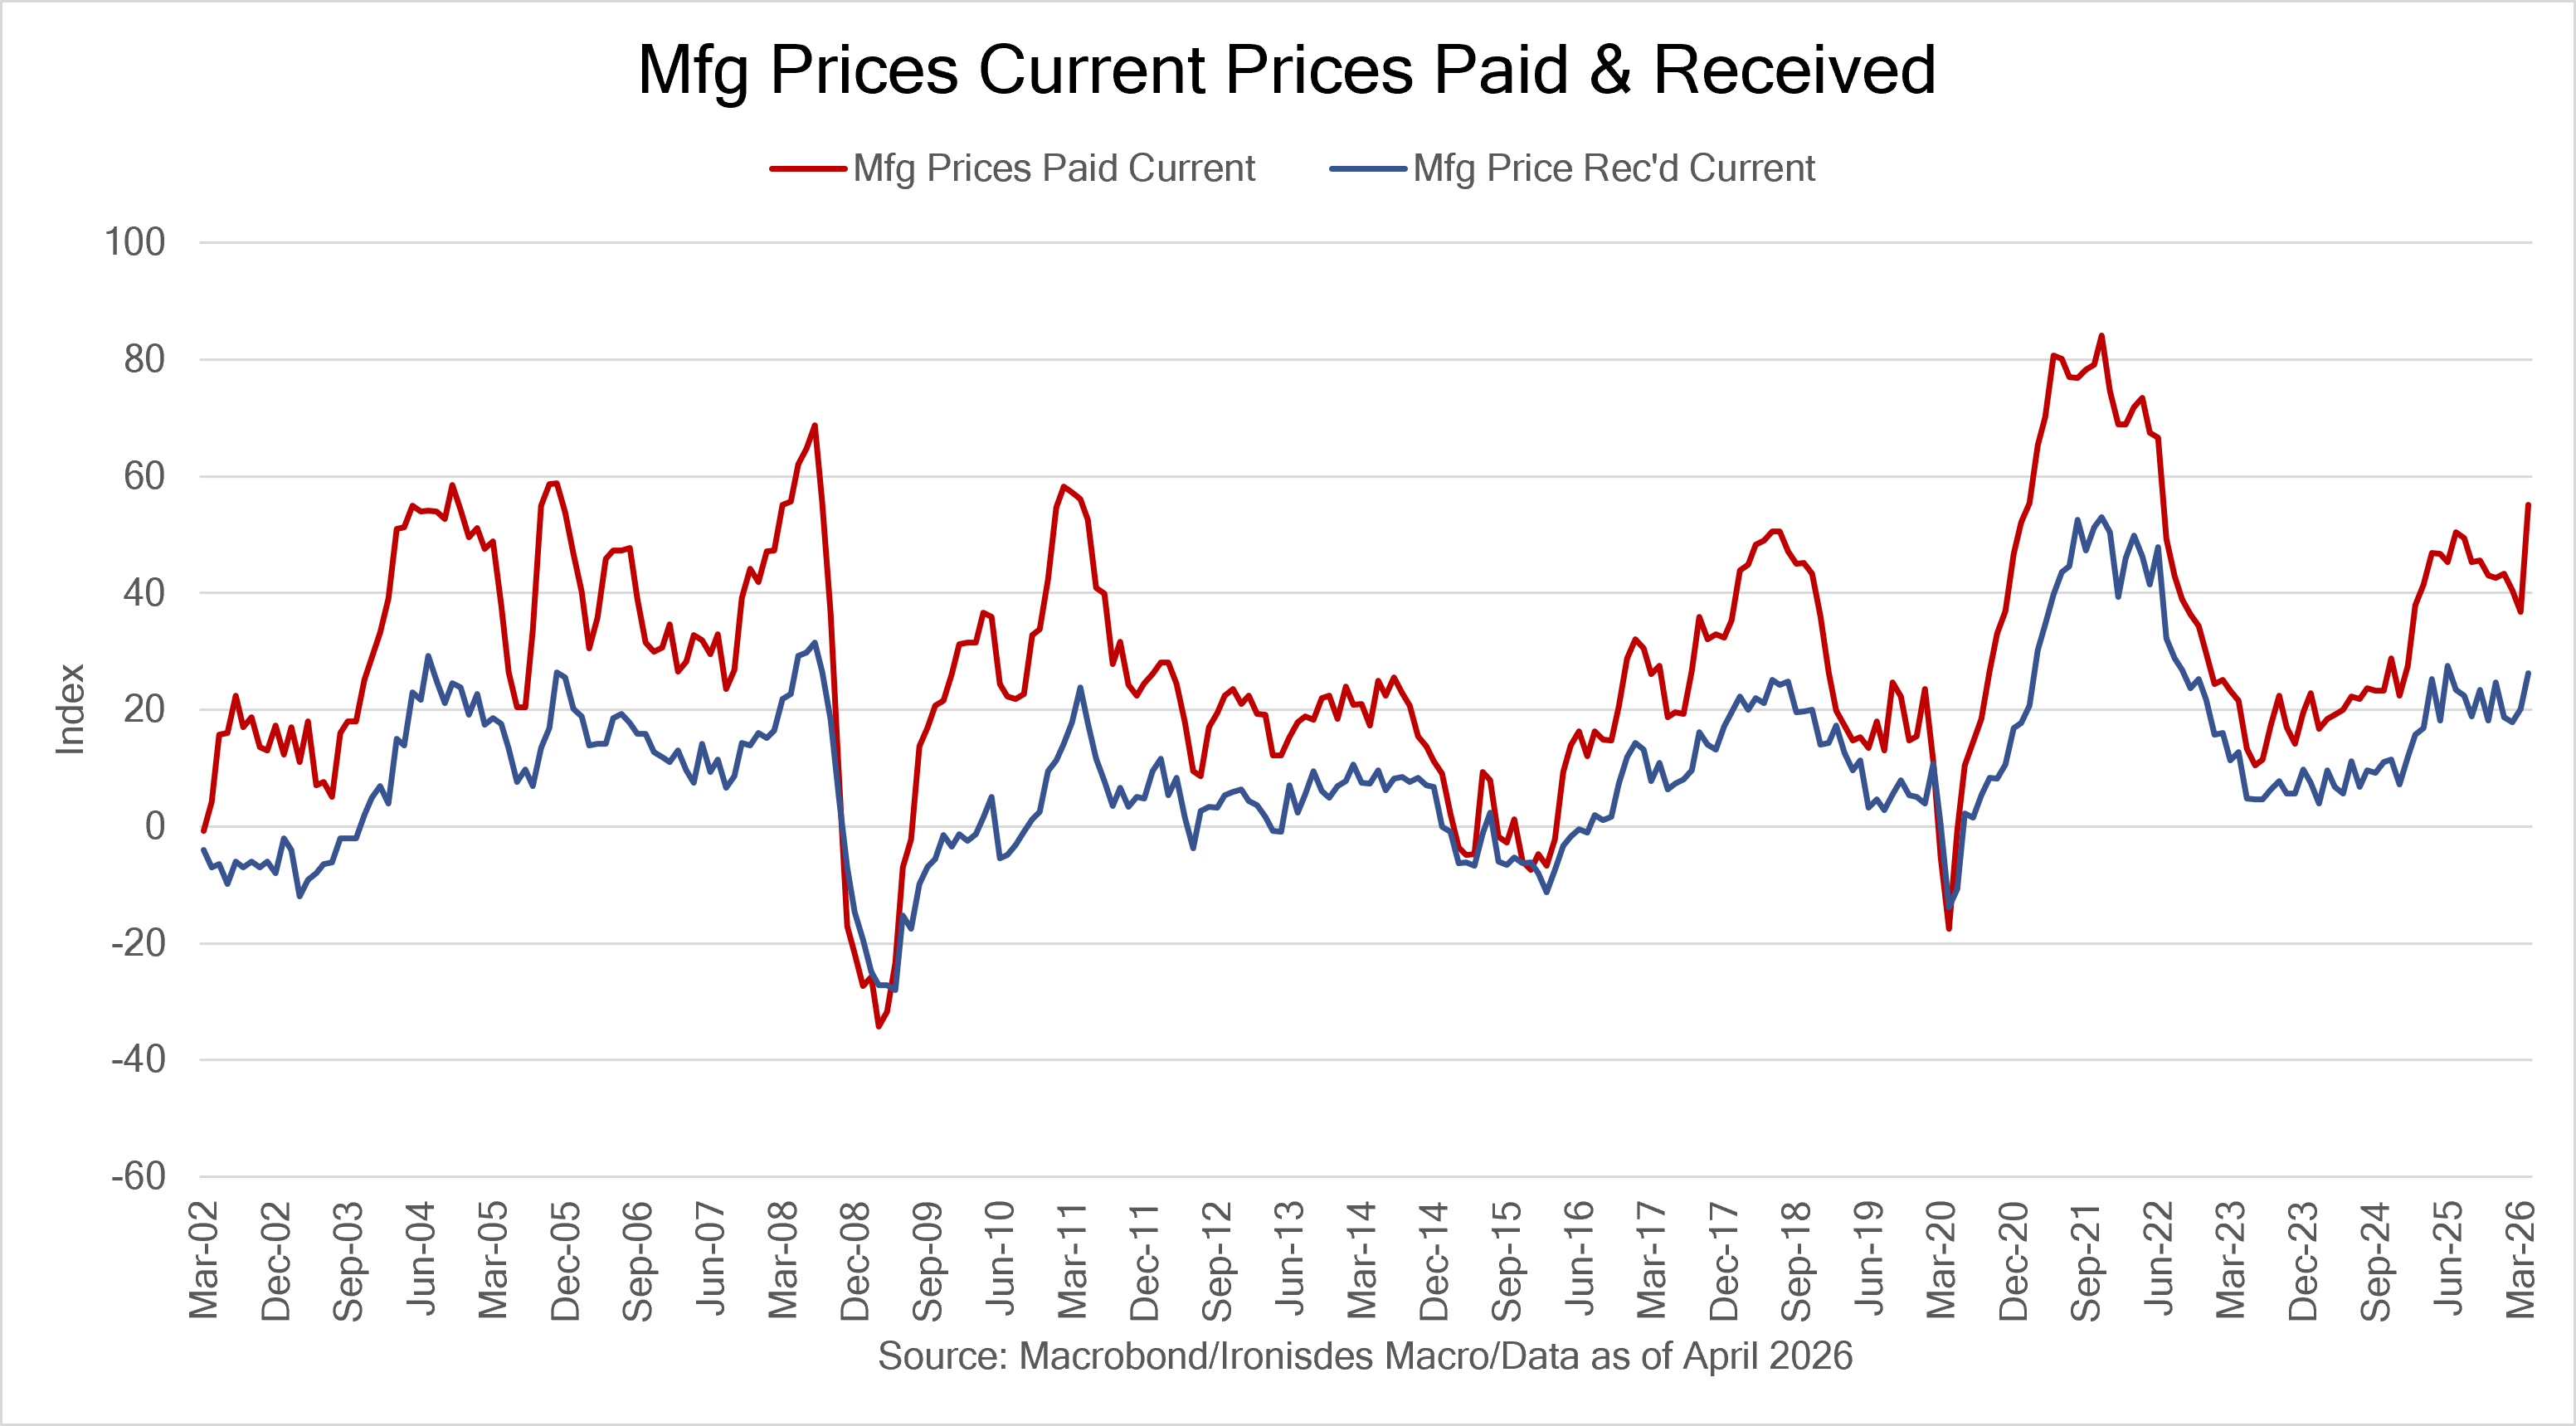
The April Producer Price Index report was hotter than expected across every major metric, final demand, ex-food & energy, ex-food, energy & trade services (retailer margins), services and core goods. However, like Thursday’s April Import Price Index report, consumer products lagged producer prices and as our next chart illustrates, they are within, albeit at the upper end of the pre-pandemic range.
The widely watched Institute of Supply Management Surveys (ISM) do not ask purchasing managers about prices received, only prices paid (input costs). Consumer companies appeared to be confident they could pass through higher input costs following Liberation Day due to their pandemic experience. As we noted, the fiscal and monetary conditions in ‘25 were the antithesis of ‘21, fiscal spending growth was 3% and M2 was expanding at a 4.5% rate, down from 45% and 27% in ‘21. Conditions are modestly more stimulative in ‘26, not because government spending or money supply growth are much different than ‘25, instead the One Big Beautiful Bill individual tax provisions increased average tax refunds ~11%. In the next two weeks the regional Federal Reserve Bank manufacturing and services surveys will provide both prices paid and prices received responses, as was the case in March and April we suspect prices received will lag input costs due to the inflationary headwinds from fiscal and monetary conditions. While the implications for fixed income investors are benign, and perhaps even an opportunity with 10-year USTs at our 4.5% ‘26 yield target, it is increasingly likely that a recovery in profit margins, and relative stock price performance of the consumer discretionary and staples sectors will be pushed into 2H26.
While we are convinced the markets view that the second order effect of energy price spike, like tariffs in ‘25, are disinflationary, Fed Chairman Warsh is going to need to be patient with a committee caught up in a debate about forward guidance and the impact of the energy price spike on inflation expectations. One of the questions we received following PPI that sounded similar to some of the commentary from FOMC participants is whether AI infrastructure demand was creating an inflationary impulse. As we’ve noted, the majority of the Fed staff and FOMC participant level are new-Keynesian demand focused economists. Consequently, while Chairman Warsh may be inclined to look through the impact of energy and commodity prices due to expected longer-term supply-side effects on productivity, he may be fighting an uphill battle. Inflation is always and everywhere a fiscal and monetary phenomenon, demand for energy and commodities to build AI infrastructure is only inflationary if policy is excessively accommodative.
There is one risk significant inflationary policy risk, and that is the Fed’s balance sheet accommodation. During this week’s quarterly refunding the Fed purchased $13.8 billion of the $58 billion 3-year auction (24%), $9.97 billion of the $42 billion 10-year auction (24%) and shockingly for those that don’t follow this closely, $5.9 billion of the $25 billion 30-year auction (24%). As we noted last week, the minutes of the October meeting revealed the Committee supported shortening the weighted average maturity (WAM) of the System Open Market Account (SOMA) from its current level of nearly 9 years to the 5.4 WAM of the outstanding stock, and some suggest it should be shorter, yet they continue to buy 30-year Treasuries. You cannot convince us these purchases are not impacting government borrowing costs, in other words the Fed is monetizing government debt, classic inflationary policy. While their Treasury reinvestment strategy continues to provide accommodation for the upper part of K-shaped business and household sectors, the average coupon of their $2 trillion mortgage-backed securities portfolio is 2.5%, a level we will probably never see again in our lifetime. They are investing the $14.5 billion per month of paydowns into Treasury bills, but at the current pace it will take 11.5 years to achieve their goal of a Treasury only portfolio.
We are not changing our forecast for two policy rate cuts, one in September and another in December, but we suspect Chairman Warsh will have a number of participants at the June meeting who want to change their implied additional adjustment easing bias to neutral, and some that want to go further. Tightening the policy rate into an energy shock is not consistent with Fed staff research on energy shocks, but there is a growing chorus of calls for hikes. Given the restrictiveness of the policy rate and balance sheet accommodation that is reducing the cost of AI infrastructure debt, a rate hike would do nothing to reduce inflation but would likely reduce employment. In other words, rate hikes would further exacerbate the K-shaped banking, non-financial corporate and household sectors. The Powell Fed would be far more likely to make this policy mistake; the Warsh Fed is unlikely to. We’d like the FOMC to get started shortening the duration of the SOMA portfolio as soon as possible, AI infrastructure investment is benefiting from tax incentives in the One Triple B Act, the Fed should not be providing accommodation as well.
“In my judgment, the Treasury should determine the maturity composition of debt held by the public, and in normal times, our balance sheet should mirror the maturity distribution of outstanding issuance to the extent possible, thus having a neutral effect on the composition of securities available to the public over time. We are moving in this direction now.”
Efficient and Effective Central Banking: Beyond the Balance Sheet, Federal Reserve Governor Barr
Note: We disagree with the theme of this speech, keeping the excessive (ample) reserve regime in place. Additionally, the timing of Barr’s speech, the day before Warsh is sworn in, suggests it was intended as an act of resistance against the new Fed Chairman and Governor that replaced him as Vice Chair for Bank Supervision, Michelle Bowman.
Finally, we just demonstrated if they are ‘moving in the direction’ of matching the WAM of the outstanding stock of Treasuries, they are taking the scenic route.
Top of the Range Treasuries?
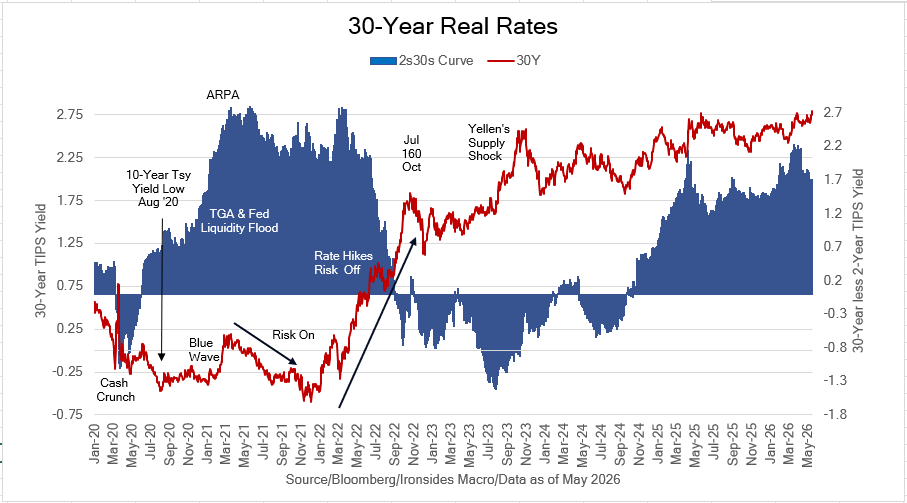
Let’s begin with the implications for equity investors of 10-year Treasuries at 4.6%, above our ‘26 target. In our next chart there are two periods when real rates (TIPS yields) were negative as a consequence of Fed large-scale asset purchases of long maturity Treasuries and mortgage-backed securities. The first time the Fed ‘tapered’ (another obtuse Fed communication tactic) these purchases a risk-off cross-asset correction that came to be known as the Taper Tantrum resulted. Interestingly, the impact on nominal and real rates, fixed income implied volatility and equities was very close to the monetary policy normalization correction in June 2004 when the Greenspan Fed began its ‘measured removal of policy accommodation’. The risk-off sell the house, sell the car, sell the kids, Apocalypse Now larger correction in 2022 was exacerbated by Treasury Secretary Yellen’s Treasury draining bank reserves aggressively by rebuilding the Treasury General Account after recklessly injecting liquidity in 2021, as well as the even more deeply negative real rates and far more aggressive rate hiking than any tightening since the Volcker Fed. We reinvested these issues because they are examples of real rate shocks, in other words high velocity increases in real interest rates.
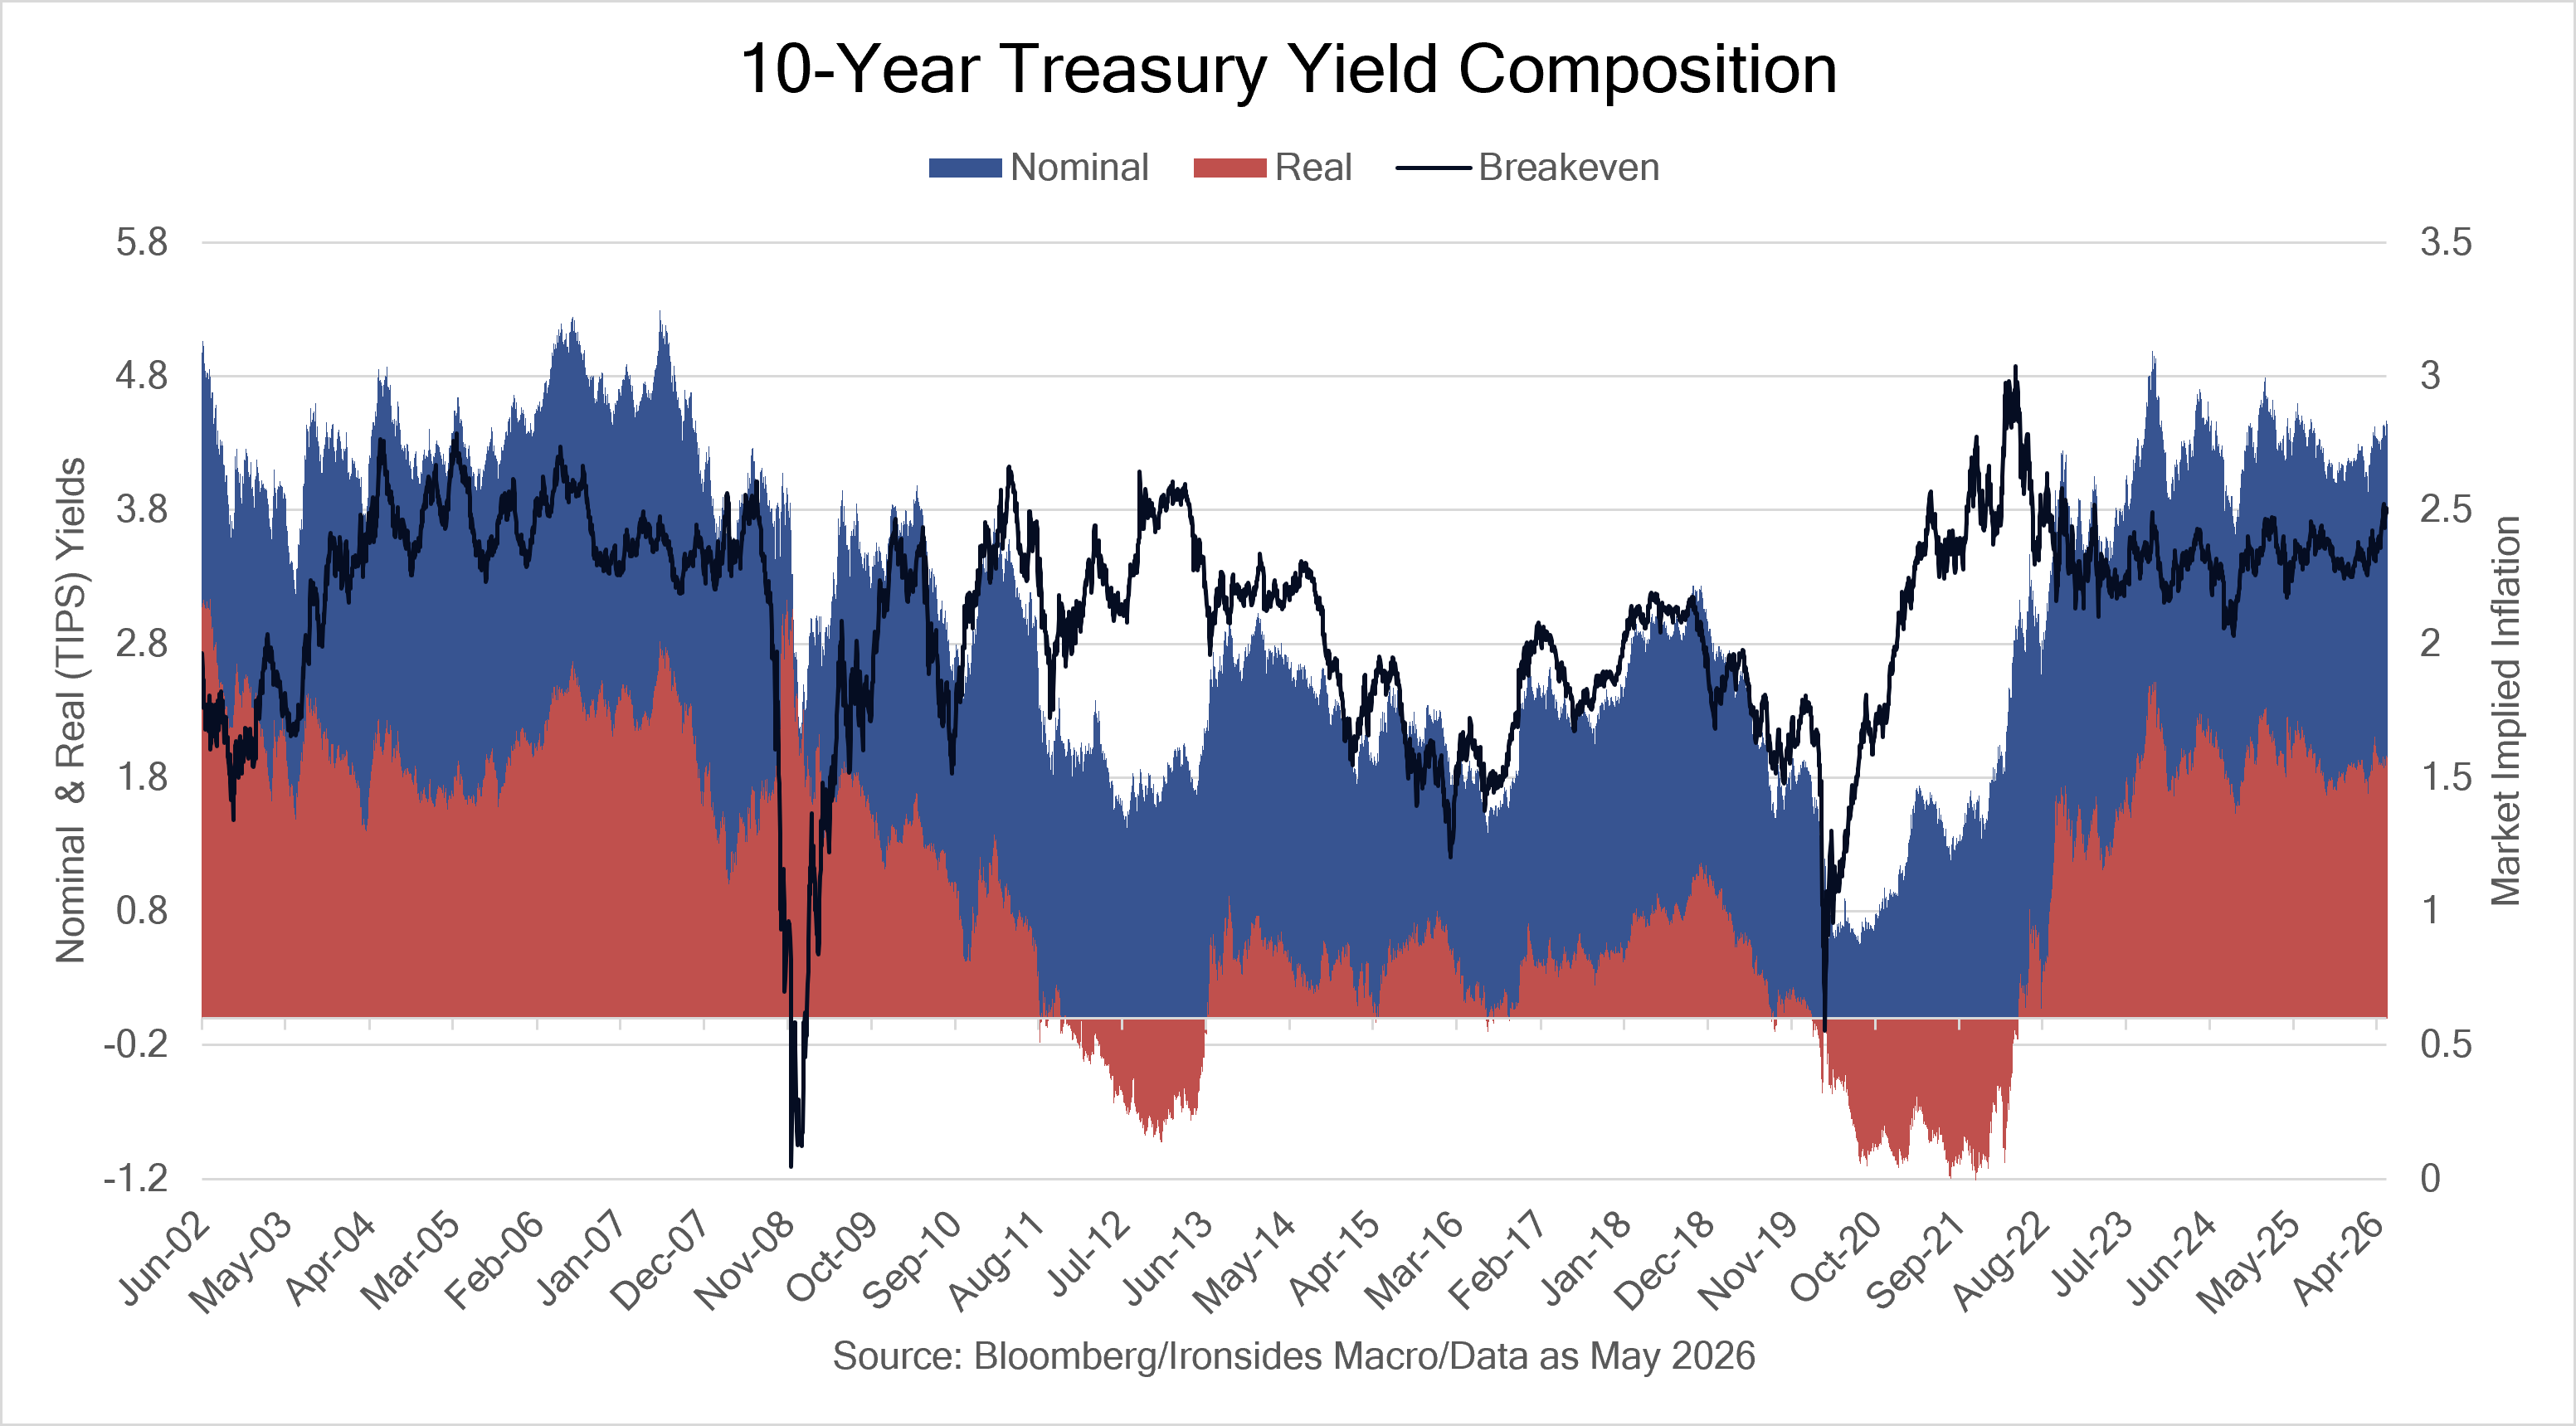
In our 2026 Outlook, Duration Tightening, we forecasted a 10% 1Q26 correction as a consequence of supply pushing 10-year USTs to 4.5%, primarily attributable to higher real rates with TIPS rising to ~2.25%. The forecast was close to correct, 10s went to 4.43% in March, TIPS to 2.11% and the S&P 500 pullback was 9%, but not due to stronger growth and supply, instead to the war and Ai infrastructure supply and expected war debt. The inflation related rate moves this week, when 10s touched 4.5% on Wednesday, were not due to real rates, instead the breakeven inflation component drove the increase as real rates were stable marginally below 2%. The level of rates, both nominal and real, although significantly higher than the ‘10s, are far from exceptional relative to the ‘90s or the ‘00s. When real rates increase sharply in response to monetary policy tightening, like ‘04, ‘14, ‘18 and ‘22, and equity market correction is as close to a sure thing as you can expect in the equity market. When nominal yields rise slowly due to modestly higher inflation, like the 1960 to 1968 period, faster nominal growth leads to operating leverage and faster earnings growth. In short, the increase in the discount rate was more than offset by faster earnings growth for most of the ‘60s, and the same dynamic is occurring currently. The real rate spike on Friday carries far more risk for the equity market.
We don’t want to lean too heavily on this analog, if 10s stabilize near 4.5%, and don’t make a run at the ‘23 5% peak, and 10-year TIPS hang around the 2% level, far below their ‘23 2.5% peak, unless we are wrong about inflation and/or the Fed makes a policy rate mistake, the Treasury market is unlikely to trigger an equity market correction. That said, until and unless disinflation resumes and the FOMC eases the policy rate, the healthy broadening out of earnings and economic growth to include consumer and small cap companies is unlikely to gain traction. Additionally, as we will explain below, we continue to have a bearish intermediate to longer term outlook for Treasuries.
This brings us to the Treasury market and the question that is the title of this section of this week’s note, is it the top of the range for 10s? Is buying longer maturity USTs with the fiscal and monetary duration mess Treasury Secretary Yellen and Chairman Powell left for Secretary Bessent and Chairman Warsh, notwithstanding the quantum leap in capital markets competence, a fool’s errand? Because of the Fed’s balance sheet, 10-year Treasury term premium is 50-75bp below the longer run median level. Incoming Fed Chairman Warsh and Treasury Secretary Bessent are too astute to recklessly unwind the Fed and Treasury (greater reliance on bill issuance) rate suppression, that said, the path to lower longer maturity rates is dependent on weaker employment and growth, a negative outcome for equities.
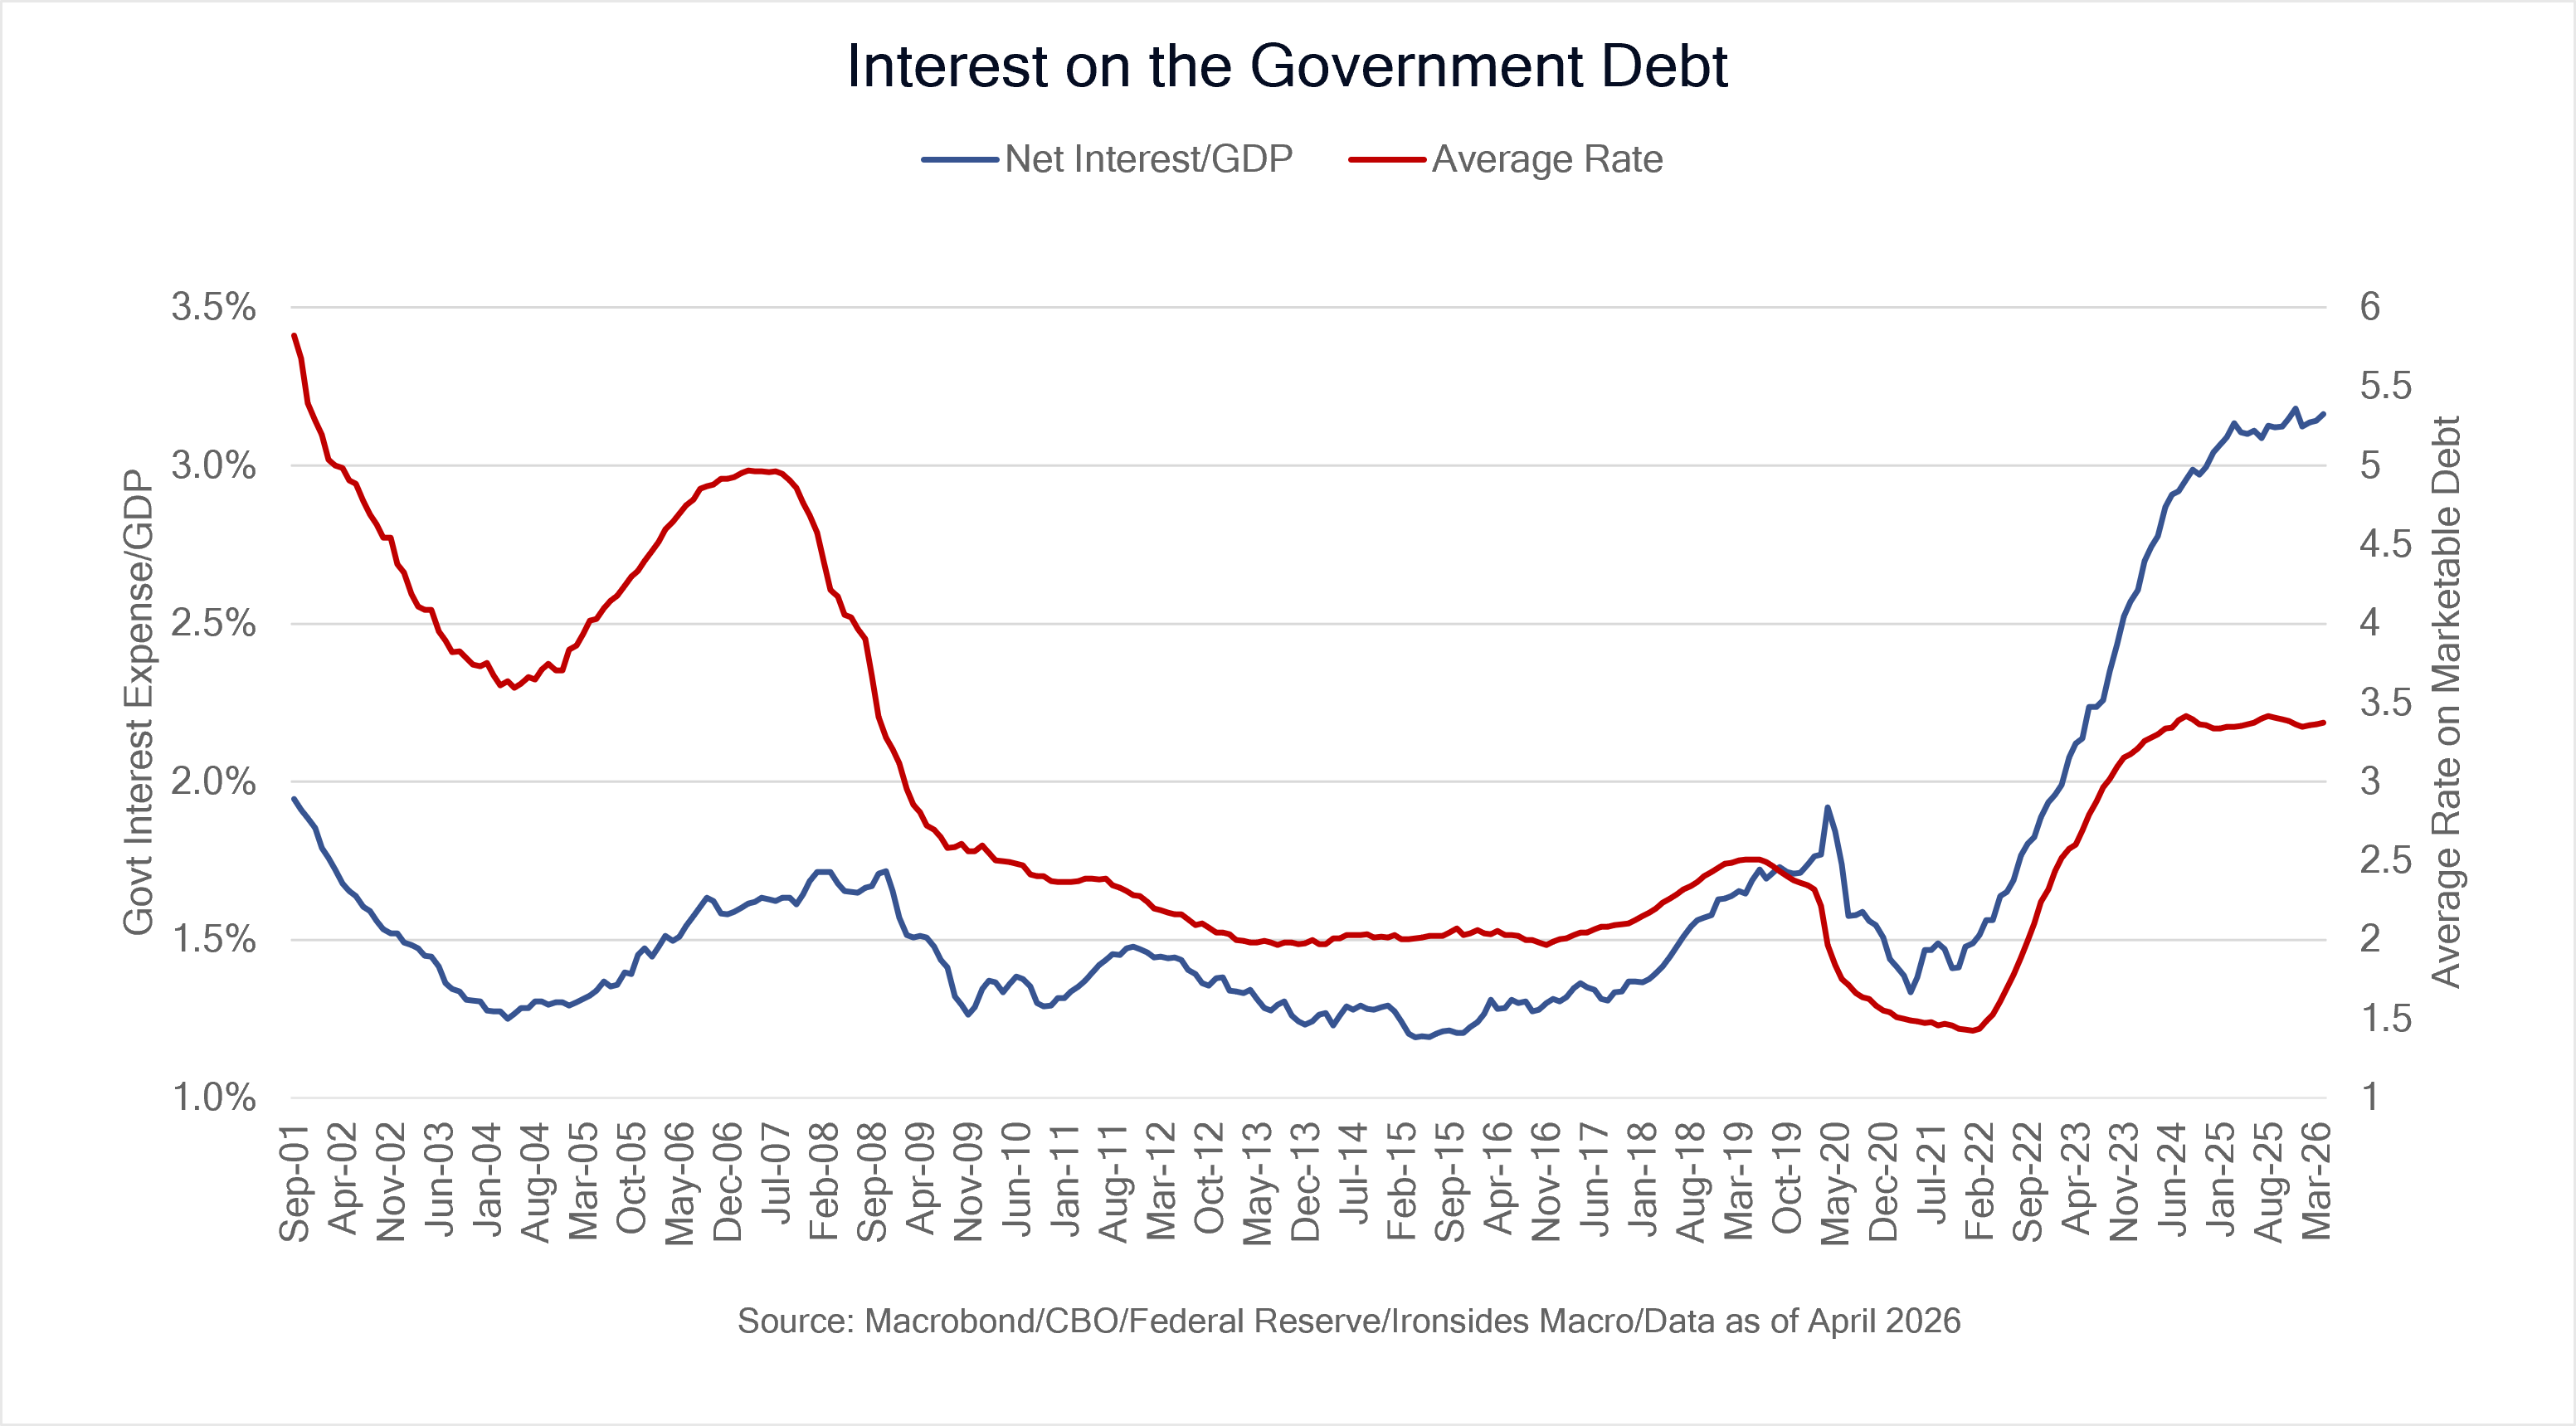
The other looming issue is interest costs. Former Treasury Secretary Yellen referenced real interest costs at 2% of GDP as an important level, during the Biden Administration interest costs increased from below 1.5% to above 3%. As a consequence of Yellen’s shift to bill issuance and the Trump Administration and Congressional deceleration in government spending growth from 11% in FY24, the final year of the Biden Administration to 3% in FY25 and through the first 6 months of fiscal year ‘26, interest expense as a percent of GDP stabilized. The outlook in ‘27 darkens for two reasons. First, spending is 23% of GDP, 3% above the 40-year median, as we’ve discussed at length, the longer run median of receipts relative to GDP is 17.1%, subject to an 80bp standard deviation by each four-year administration since WWII. Consequently, the only path to stabilizing the growth of debt is reducing spending to 20% of GDP such that receipts less spending before interest costs is zero (primary balance). The reduction in spending growth in FY25 and FY26 has been primarily discretionary spending, year-to-date ‘26 mandatory spending growth is 7%, discretionary spending growth is -0.1%. The second issue is the potential loss of the House and the debt ceiling. In 2018, shortly after the Tax Cuts & Jobs Act the Trump Administration agreed to a budget deal with the Democratic Party controlled Congress to bust the Budget Control Act of 2011 2% spending growth cap. A repeat is possible, if not probable in 2027.
Global factors are worth considering as well. One of the key structural trends investors are underestimating is the impact of a restructuring of global trade flows on demand for fixed income. When the largest bilateral trade imbalance was the US and China recycling the surplus into USTs was the obvious destination. Tariffs, and now the war, disrupted the flow into USTs. Additionally, Japan’s unwind of far more aggressive rate suppression than the Fed, Germany ending the debt brake, the UK government’s reckless spending and the ECB heading towards a repeat of Trichet’s massive policy mistake in July 2008 are intensifying the pressure on global fixed income flows. While most of the rest of developed economies are short oil, hiking rates to respond is bad policy. The broader issues are the bigger issue, if the spike on Friday was primarily attributable to central bank policy yield curves would be flattening, instead they steepened.
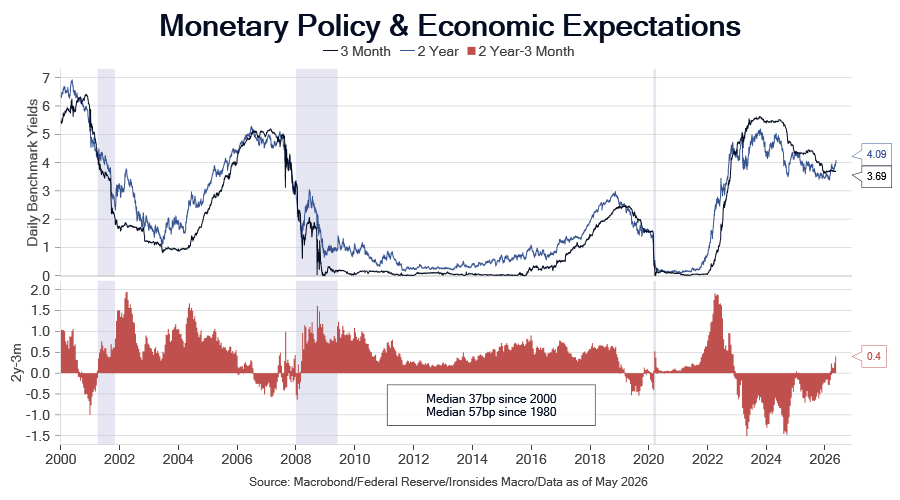
To increase demand for longer maturity Treasuries likely requires rate policy easing to increase household and small bank demand, and even if our inflation outlook is correct, we do not expect a cut in the policy rate until September. As our next chart illustrates, the energy price spike dissipating is likely to reduce rates 25-30bp in the belly of the curve. Vice Chair for Banking Supervision Bowman’s regulatory roadmap is another potential source of demand for Treasuries, however, small banks haven’t significantly increased holdings since the regional bank failures in 1H23 and large banks have been adding in ‘26.
We have had a below benchmark allocation to fixed income since we declared an end to the 39-year bond bull market in August 2020. The Fed’s balance sheet and what now former Fed Governor Miran coined Activist Treasury Issuance (ATI) led to structural overvaluation of longer maturity Treasuries. We are tempted to fade the inflation driven selloff and add to our Treasury exposure, but our longer run outlook looms large. Instead, we are going to modestly reduce risk in our equity holdings and move the capital into the front end of the Treasury market. The probability of the Warsh Fed making a rate policy hike mistake is low, consequently, putting the capital into the front-end even if we do not get the cuts we expect as the inflation shock passes, is a low-risk proposition.
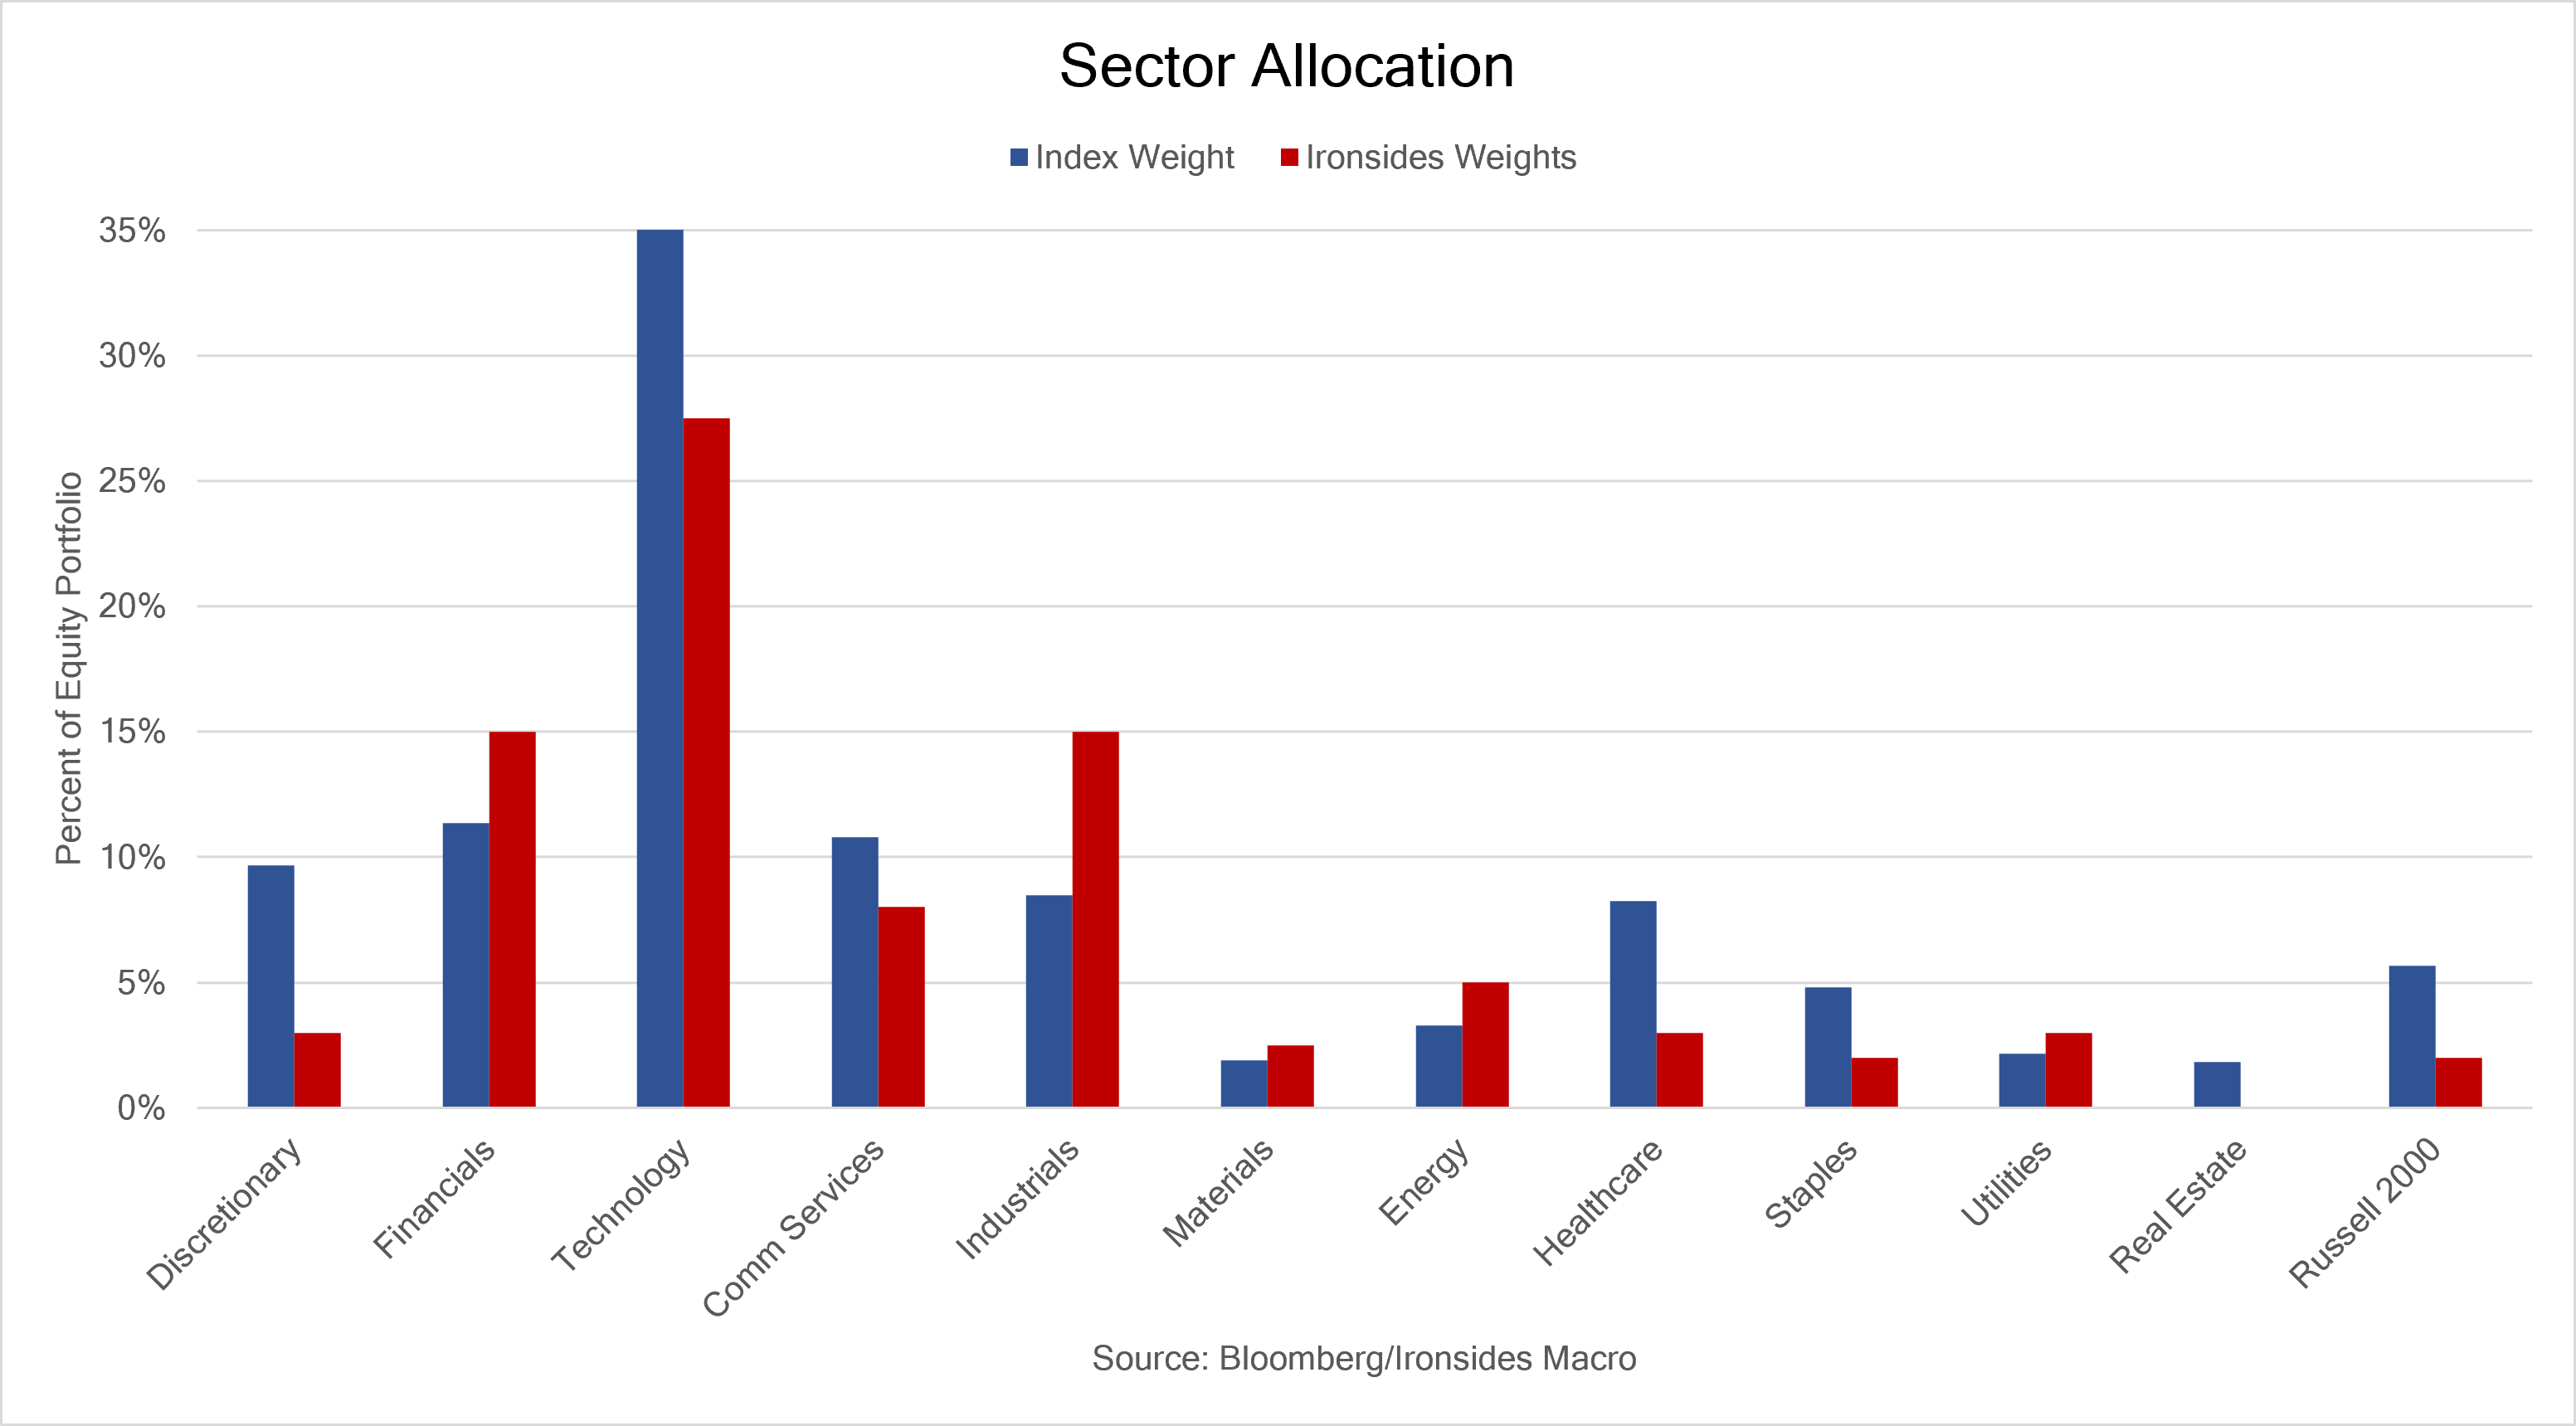
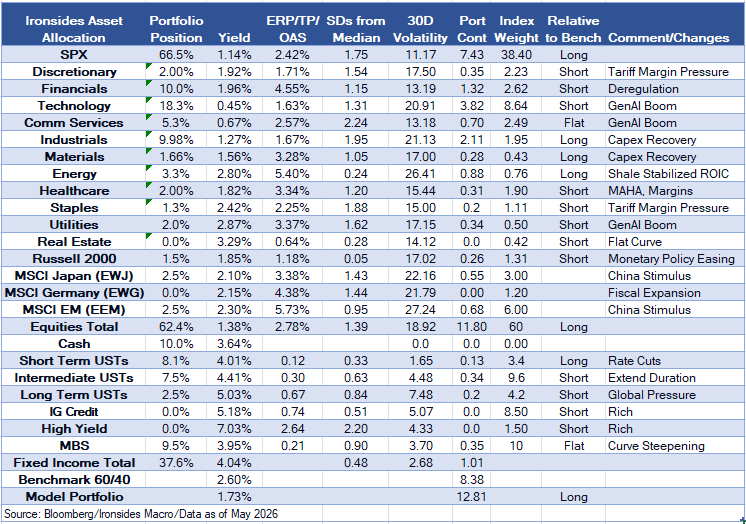
A component of our changes is our expectation that 2Q26 earnings will be disappointing in economically sensitive sectors as the impact of the One Triple B transfers wanes and margin pressure persists. Additionally, if we are correct that growth and employment weakness alongside disinflation are necessary conditions for rate policy easing at least through the summer, the equity market, other than perhaps the AI theme, is vulnerable. Consequently, we are reducing our allocation in the consumer discretionary sector from 5% to 3%, financials from 17.5% to 15%, healthcare from 3% to 2% and the Russell 2000 from 3% to 2%. Our short-term Treasury allocation increases from 6% to 8.1%, cash in the equity portfolio from 7.5% to 14% and for the asset allocation portfolio from 8.5% to 10%.
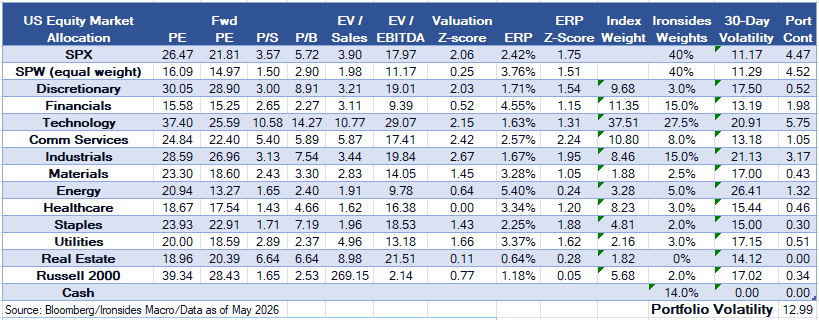
Sector and Asset Allocation Tables Explained:
The US Equity Market Allocation table is our recommendations for a US equity investor, a similar approach to when we were the Head of Barclays US Equity Portfolio Strategy. The first six columns are valuation metrics, the seven is a Z-Score summary of the metrics relative to each sector’s valuation range since S&P introduced each sector (1990 for all but Real Estate). A reading of 1 implies the sector is 1 standard deviation above its historical median. The equity risk premium (ERP) column, also known as the Fed Model, is the forward (expected) earnings yield less the real 10-year yield (TIPS). Index weights are the S&P 500 with the exception of the Russell 200 small cap index, that is based on the market cap of the Russell 2000 relative to the Russell 3000. The final three columns are the Ironsides recommended weight, the 30-day volatility of the sector and portfolio contribution of our recommended weights to the risk (volatility) of the portfolio. Importantly, this approach does not integrate cross correlation of the sectors.
The asset allocation table benchmark is a 60/40 (stocks/bonds) portfolio, under the assumption that the investor is investing US dollars. We begin with our recommended weights, add the yield, the third columns are valuation metrics. ERP is the equity risk premium. TP is the term premium for Treasuries using the Adrian Crump & Moench model from Bloomberg. OAS is the option adjusted spread (early call risk) for fixed income securities. ‘SD’s’ from the median is a Z-Score approach to the valuation metrics, positive readings imply the asset is expensive, negative readings imply the asset’s valuation is below its longer-run median. The sixth column is the assets contribution to the risk of the portfolio, its volatility multiplied by the recommended weight of the asset. The index weights for equities use the same approach as the equity only portfolio, benchmarked to the MSCI World Index, adjusted for the 60/40 benchmark. Fixed income weights are based on the Bloomberg US Aggregate Index, adjusted for the 60/40 benchmark. The final two columns are self-explanatory.
Barry C. Knapp
Managing Partner
Director of Research
Ironsides Macroeconomics LLC
908-821-7584
bcknapp@ironsidesmacro.com
https://www.linkedin.com/in/barry-c-knapp/
Follow us on X @barryknapp