

Q2 Outlook: Policy vs Productivity
Less liquidity, 60/40 model meltdown, The Fed's inflation process, more investment, nibbling at EM equities, stick with reflation sectors


The Liquidity Trickle Strikes
In our 2022 outlook notes we detailed a much tighter liquidity environment relative to early 2021 due to Fed tightening, the Treasury rebuilding their general account at the Fed (TGA) and inflation politics slowing fiscal outlays. We expected the ‘liquidity trickle’ to lead to a difficult first half for markets, but resilient economic output as counterproductive policy receded only to reveal the less appreciated effect of the pandemic, faster productivity growth. The first quarter, like the end of zero rate policy at the December 2015 FOMC meeting, began with a standard Fed policy normalization correction. The Fed took two important steps to stabilize credibility: first, consensus of FOMC participants to tighten policy beyond neutral, and second, beginning balance sheet contraction sooner than markets expected. Equities rallied sharply following the hawkish FOMC meeting and follow-on participant speeches due in part to the valuation reset resulting from the Fed policy correction as well as credibility stabilization.
As the quarter draws to a close, the pace of monetary policy tightening seems likely to quicken in 2Q (larger rate hikes and balance sheet contraction) as an inflation peak has been delayed by a third globalization shock in four years. Faster removal of excessive, counterproductive monetary policy accommodation is an issue for markets, but not for nonresidential capital investment. The low level of rates didn’t boost capex last cycle, and a steady uptrend in rates didn’t hold back the ‘60s capital investment boom. While it is too early to resume the equity bull market associated with the ‘20s expansion, we expect the three drivers of productivity — robust capital investment, labor dynamism, and technology diffusion — to result in better-than-expected profit margins. An improving mix of growth, involving less consumption and more investment, is not discounted in terminal policy rates or longer-term Treasury yields. We are on the more optimistic side of growth and earnings forecasts due to our outlook for strong investment and productivity growth. We have been caught by the crowd on our early calls that the pandemic was an inflationary shock, and the monetary and fiscal policy response was an overreaction. We also have an out-of-consensus view that the terminal policy rate is considerably higher than last cycle’s peak of 2.5%. An improving earnings outlook will eventually overcome stagflation concerns, setting the stage for a strong finish for equities in 2022.
60/40 Model Meltdown
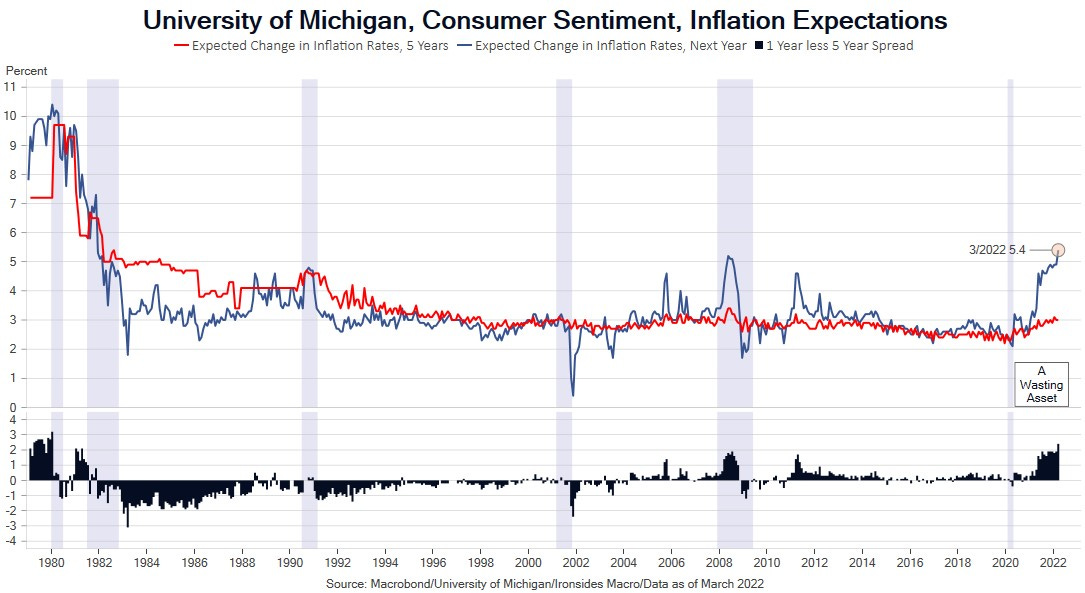
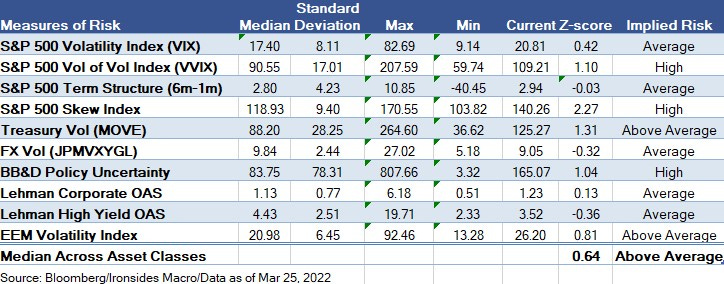
Sharply higher Treasury yields and equities following the hawkish FOMC meeting, and series of hawkish participant speeches headlined by Chairman Powell’s NABE Conference speech, seemed to catch fixed income investors conditioned by a 39-year bond bull market by surprise. As unlikely as the FOMC’s summary of economic projections forecasts for inflation, growth and unemployment were, the market narrative that the Fed was likely to cause a recession within the forecast horizon (18 months), as evidenced by the year-to-date flattening of the 2s10s nominal Treasury curve from 0.68% to 0.22%, struck us as improbable as well. We had a couple of discussions this week, one with a building products and housing analyst, the other with an energy expert, that indicated that the Russian Invasion supply shock is just beginning to work its way into prices. We also attended (virtually) an Economics Club of New York event with Glenn Hubbard and Larry Summers that detailed the generalized new-Keynesian inflation demand-driven inflation process. With the supply and demand inflation outlooks both looking pretty bleak, we turn to the constant between wage growth and price inflation in Dr. Summers’ inflation process, productivity. Chairman Powell was asked about the outlook for faster productivity during his NABE Q&A, and he began by answering that it is “something that just happens”, before acknowledging the pandemic might spur service sector technology adoption. Policy, both fiscal and monetary, primarily targeted demand through the pandemic, which served to exacerbate imbalances. We suspect monetary policy will miss faster productivity growth, but fortunately the costs are likely to be smaller than the 2021 inflation mistake.
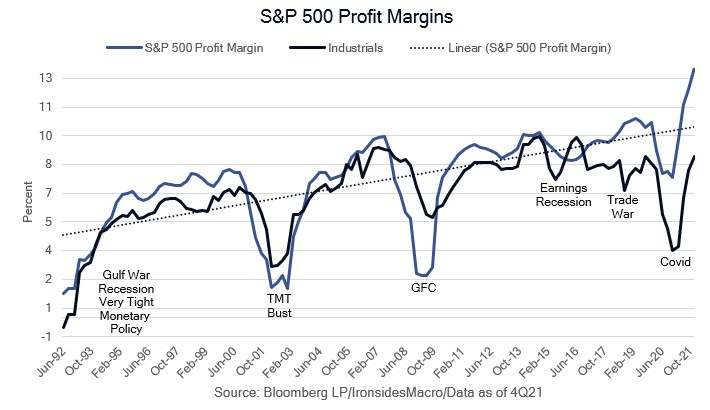
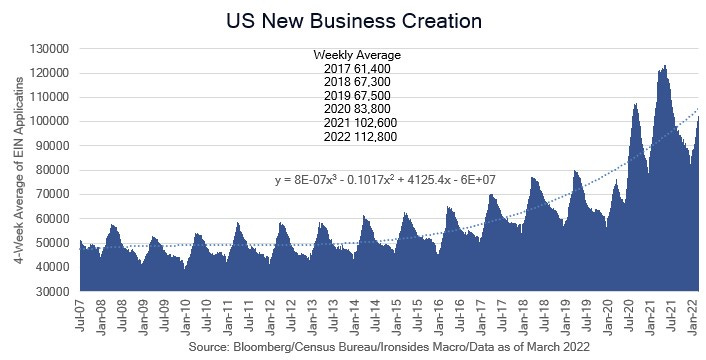
Later we found a policy paper, The Case for Economic Dynamism, that reads as if the US economy is a European social democracy crippled by labor noncompete agreements, excessive licensing requirements, immigration policy NIMBY (not-in-my-backyard) land-use and zoning restrictions. These are surely major impediments to labor dynamism, however, the pandemic and resulting inflation had some surprising effects. New business creation nearly doubled from pre-pandemic levels, small business employment significantly outperformed large enterprises throughout the pandemic, worker reallocation has been rising as the China labor shock fades and accelerated during the pandemic to the most dynamic level since the ‘90s, and profit margins continue to rise as US companies get increasingly efficient. We are far from convinced that policymakers comprehend the counterproductive effects of pandemic fiscal and monetary policy; however, the forces of spontaneous economic order, creative destruction and dynamism play a larger role in the US than any of our economic competitors and those factors remain more influential than the misguided policies of our ‘elite technocrats’. In the short term, next week brings the last employment report prior to the May FOMC meeting. A report that indicates diminished slack is boosting wage growth is likely to lead to a 50bp hike and the start of balance sheet contraction that will set up a battle between stronger than expected earnings and tighter monetary policy in April. The struggle is likely to leave equity investors relatively unscathed, and bond investors battered like the ‘94 aggressive rate hike cycle. Since the close prior to the FOMC meeting, equities have rallied 6.6% and bond yields are up 33bp, troubles for the 60/40 model are just beginning.
The Fed’s Inflation Process
Larry Summers’ simplified inflation model, wage growth less productivity equals consumer price inflation, is useful for understanding FOMC participants and Federal Reserve staff policy reaction function due to the stranglehold that new-Keynesian thought has on the FOMC participants and the entire Federal Reserve system. We have several problems with this model: the first issue is the effect that the global labor supply shock had on goods inflation during the globalization boom from 1990 through 2015. The model seems to assume that causation always runs from labor slack to prices, while at times supply shocks and misguided policy ‘flipped’ the causation (like the ‘70s and the pandemic). Finally, as we have been arguing, wage growth is accelerating for two reasons — the diminished slack that the Fed is focused on, as well as faster reallocation that should boost productivity over time. Let’s leave our productivity and globalization issues aside for now, in part because even if we are correct, we are solving for the Fed policy reaction function in the coming months.
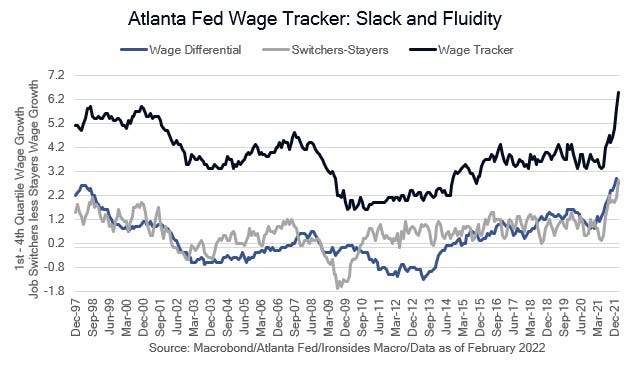
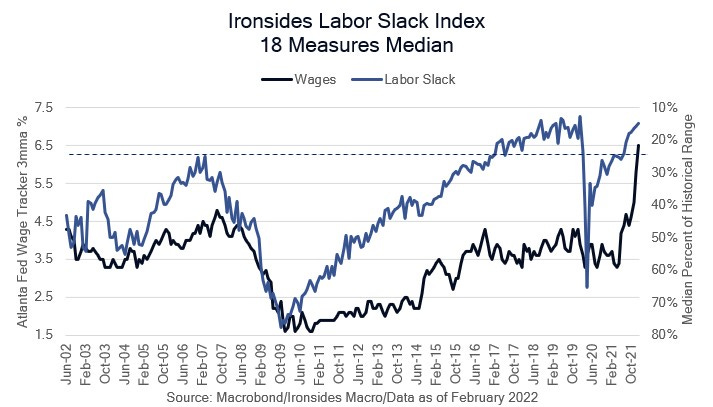
In Dr. Summers model, 6.5% wage growth less 1.5% productivity (we see a 2% trend) implies 5% trend consumer price inflation. In his view, a 4.5% unemployment rate would not reduce wage growth sufficiently to ease inflation to anywhere near the Fed’s 2% target and the Fed expects inflation to slow with a 3.5% unemployment rate. In one of Chairman Powell’s 2H21 press conferences he described an inflation process not dissimilar from Summers’ model, and his explanation for the decision to accelerate the tapering of asset purchases cited the surprisingly strong 3Q21 employment cost index as the primary catalyst. Consequently, the March employment report, February JOLTS survey and April 28 release of the 1Q22 employment cost index are the crucial releases that will determine whether the May hike is 50bp and whether Powell follows through on his soft commitment to begin balance sheet contraction at that meeting. Our labor slack model is at the 2019 peak despite pandemic and policy impaired participation, and taken with rapidly accelerating wage growth it appears that the labor market left the non-accelerating inflation rate of unemployment (NAIRU) or the Fed’s full employment model in the dust. Even if the March report builds on the February recovery in participation, we doubt there will be sufficient evidence of slowing wage momentum to convince the FOMC the wage price spiral risks have been sufficiently reduced. We suspect the pendulum has swung back to labor market data from the inflation reports in the lead up to the next FOMC meeting in terms of the impact on policy and markets.
The Mix Matters: Less C and More I
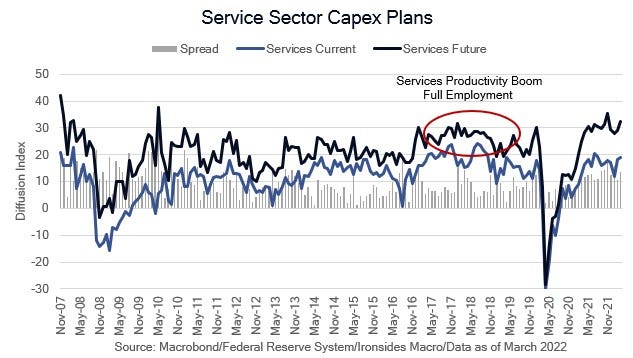
Capital spending plans from March Federal Reserve manufacturing surveys remained strong, near multi-decade highs. Core capital goods shipments are running 15.6% annualized over the last three months. We expect another surge in hours worked from the March employment report. February industrial production, retail sales and single-family housing starts all point to considerable economic momentum through February, while jobless claims imply the momentum continued in March despite weaker consumer sentiment due to rising inflation and concerns over the Russian Invasion. While a shift from goods to services consumption is widely expected, we expect the shift to be delayed due to auto and housing sales running substantially below demand due to supply constraints. Capital spending plans, core goods orders and shipments, manufacturing structures investment, intellectual property products (software) are all strengthening as evidenced by 4Q21 S&P 500 capital investment plus R&D at 14.3% year-on-year. We expect the Russian Invasion to strengthen the outlook for capital spending. This was the third supply chain shock in four years, and failure to derisk supply chains is corporate malfeasance.
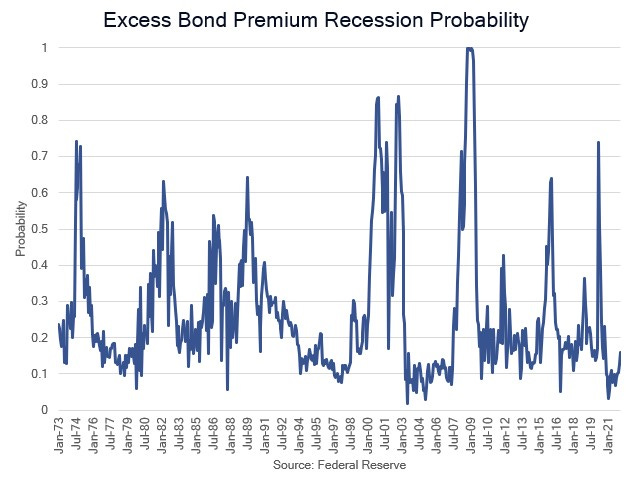
We do not view the year-to-date flattening of back-end Treasury yields as a meaningful leading economic indicator. Those yields are suppressed by the stock of Fed assets and the increased role of the dollar in trade finance and safe assets and importantly, unlike 2019 when a global export and manufacturing recession led to a bull flattening inversion of long rates, the curve is bear flattening. Put simply, 10-year treasury yields are up 96bp year-to-date. We agree with the findings from this paper The Near-Term Forward Yield Spread as a Leading Indicator: A Less Distorted Mirror, our Fed policy proxy is bear steepening aggressively to the tune of 1.27% year-to-date. In other words, for the forecastable horizon of ~18 months, investors do not expect a recession. One other notable Fed analysis developed a model for excess bond premium, Recession Risk and the Excess Bond Premium, the component of credit spreads with the most robust information content to forecast recessions. The model, expressed as a probability of recession was at 15.9% at the end of February.
Too Early for Emerging Markets?
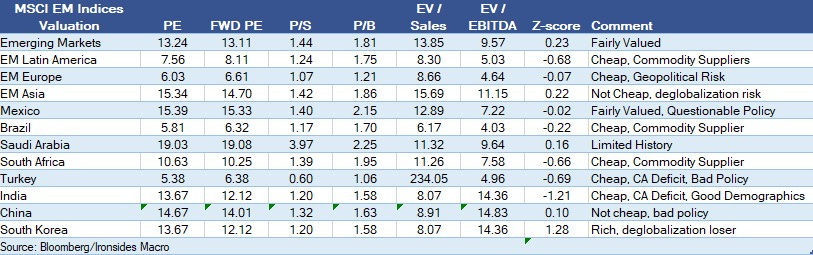
We’ve received a number of questions about emerging market equities recently. Rising inflation, tighter monetary policy, and a modest increase in the trade weighted dollar are negative factors. Rising commodities and energy in particular are problems for some and benefits for others. Notably, the dollar’s evolution into a petrocurrency is an issue for oil importers (China, India, Turkey), particularly those with current account deficits (India and Turkey). While we expect trade growth to slow in 2022, thus far Asian exports continue to expand rapidly. We spent time this week looking at emerging market valuations, and generally Latin America looks attractive, Asian markets are unattractive, while European markets are cheap for a good reason. Here is a valuation snapshot and some general thoughts on the regions and several of the largest markets. We will write more about emerging market equities, but generally we suggest a marginal increase in exposure ex-China. In other words, do not buy iShares emerging markets (EEM) due to the 29% allocation to Chinese equities.
Wrapping it Up
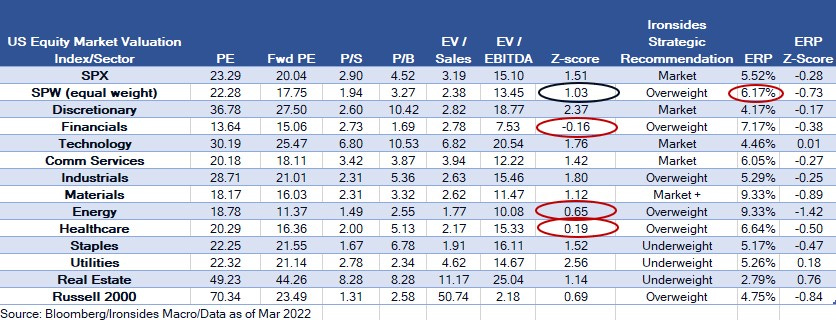
The S&P 500 retraced slightly less than 2/3’s (61.8% for you Fibonacci fans) of the drop from 4800 to 4100, we pounded the table following the 12% appropriate adjustment to the start of the monetary policy normalization cycle and gain prior to the March FOMC meeting. From the 4500 level the risks are more balanced, though Fed normalization corrections are completely reversed implying the S&P 500 will likely end the quarter in the vicinity of 4800. Valuation generally matters more in mid-cycle following the Fed correction, and we have received a few questions about equity risk premium (ERP) models that utilized nominal interest rates. Equities are real assets, book value of assets rises with inflation, bonds are nominal assets. For that reason, the correct discount rate is a real rate (TIPS yield). Our ERP model is 5.52%, the longer-run median is 4.95%, in other words stocks remain quite cheap to bonds despite the increase in the 10-year TIPS yield from -1.1% to -0.51% in 2022. Technology and related sectors (consumer discretionary and communication services) need another 1 to 2 quarters of strong results without much upside in price to improve the valuation proposition. Our cyclical and healthcare overweights, with the exception of industrials, offer better valuation and leverage to our non-consensus call for stronger than expected earnings growth. Defensive sectors typically outperform during Fed policy corrections and this one was no exception. Staples and utilities are exceptionally expensive; we would avoid them. We would continue to underweight fixed income, particularly long duration securities. Short term credit offers better risk reward due to consensus catching up to our hawkish monetary policy outlook and modest widening of credit spreads.
Key Investable Themes & Asset Allocation:
Deglobalization & Capital Spending Boom: Industrials, Semis
Reflation: Materials, Financials, Energy, Small Caps
Technology Innovation Diffusion: Healthcare, Industrials and Financials
Fed Balance Sheet Contraction: Short Duration, Long-term Fixed Income Volatility (PFIX)
Global Equity Allocation: Overweight US equities, underweight export dependent economies (China, Germany, Japan)
US Asset Allocation: Overweight equities, underweight fixed income spread products, use cash as your risk reducer. Reduce cash, add equities.
Barry C. Knapp
Managing Partner
Director of Research
Ironsides Macroeconomics LLC
908-821-7584
bcknapp@ironsidesmacro.com
https://www.linkedin.com/in/barry-c-knapp/
@barryknapp