
Peak Goods Prices, Services Still Rising
Peak Goods Prices, Services Still Rising
Peak pandemic inflation, 1Q22 looking strong, NYC Trip observations, banks are cheap

Peak Pandemic Inflation
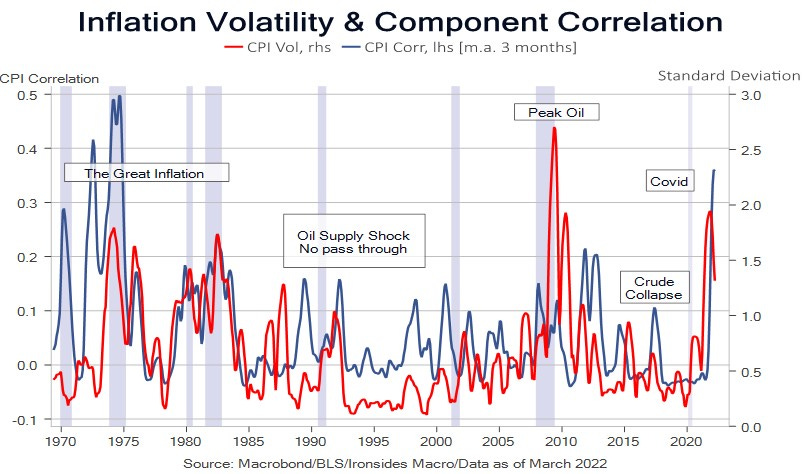
The most indicative subseries from the March CPI, PPI and Import Price Indices releases this week was the monthly change in consumer goods ex-autos import prices: December increased 0.5%, January 0.4%, February 0.3% and March 0.2%. This is consistent with core goods prices from the CPI report that fell 0.4% following a 0.4% increase in February and a monthly average increase of 1.1% in the prior four months. Imported goods prices were the primary disinflationary impulse for the last three decades and are the largest driver of inflation today. Even as CPI hit a new cycle high at 8.5%, the annualized standard deviation dropped to 1.32% from 1.48% in February and the cycle peak of 1.94% in October and November. Our measure of correlation of 20 major components fell to .34 from .37, a level that was only exceeded in 1974 and 1975. The April University of Michigan inflation survey was stable, and sentiment improved sharply due to improved household finances expectations. As we discussed in Inflation Backwardation, expectations of peak inflation, not a recession, drove the yield curve inversion. Since the Fed effectively announced the beginning of balance sheet contraction, the 2s10s curve has steepened 45bp leaving little doubt that the TIPS and term premium curves are primarily impacted by QE, not growth. The first order pandemic supply chain inflation peaked, however pandemic policy inflation, housing in particular, is likely to continue to increase for months to come.