Labor Market Conundrums
Bank Capital, QT & Bills Only Policy, Quadrilemma Turning Point, Inflation Outlook, The Earnings Recovery, Manufacturing Renaissance
Note: We are not going to release a payroll preview note following the release of the January Job Openings & Labor Turnover Survey on Wednesday due to a busy schedule in NYC. We preview the crucial February employment in this week’s note.
Monetary Policy Report to Congress
It is crunch time for our ‘Quadrilemma’ thesis, which is our view that in order for the Fed to cut to 4% in ‘24, the level required to painlessly disinvert the 3m10y yield curve with a 10-year Treasury near 4% that will reopen regional bank credit channel, the unemployment rate needs to exceed 4% and wage growth cool below 4%. The Treasury market absorbed massive supply in the soft underbelly of the curve (2s, 5s and 7s) partially on hopes that the hot January inflation and employment data was distorted by seasonal adjustment factors corrupted by the pandemic and the data will cool in coming months. We are sympathetic to that view, however, as we will discuss we are less sanguine than FOMC participants or most street forecasters about the longer-run inflation and natural (r*) rates.
Expect the financial news and street research to focus on rate policy ahead of Chairman Powell’s Semi-Annual Monetary Policy Report to Congress on Wednesday and Thursday. However, the more important theme could be Republican Senators airing grievances over the Administration and the regulatory proposals of their appointees, including Fed Chair for Bank Supervision Barr, FDIC Chair Gruenberg, and acting Comptroller of the Currency Hsu.
Fed Governor Bowman provided a preview this week with a warning of the macro implications of these proposals, that include an increase in the GSIB (largest banks) surcharge, Basel III endgame rules, long-term unsecured debt requirements for banks with more than $100 billion of assets, CRA rules, restrictive mergers & acquisition reviews, climate change, interchange fees and liquidity requirements. These policies threaten to return banks to the 2014-2018 and 1950’s excessive regulatory regime that capped return on equity at 10%, thereby impairing the flow of credit leading to uneven economic activity and weak capital investment, not to mention poor stock price performance. Of course, even if Chair Powell comes down on Barr’s side in the dispute with community banker board member Bowman and pushes through these excessive and poorly constructed proposals, a Republican controlled White House will reverse these rules in short order.
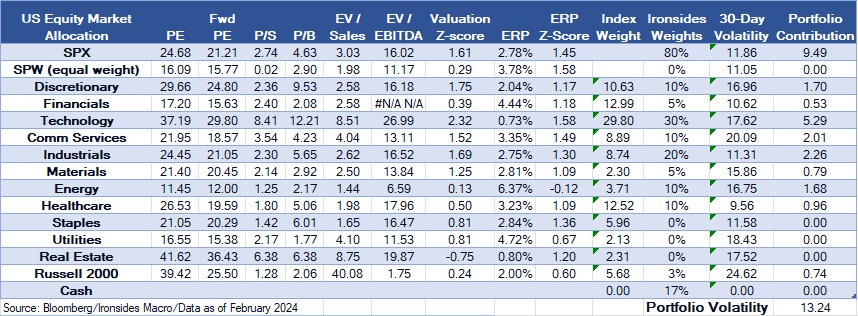
The first two months of 2024 are in the books. Hotter than expected inflation and employment data led to a convergence of market expectations for a year-end monetary policy rate of 4% and the December FOMC Summary of Economic Projections forecast for a 4.75% rate. We frequently hear the markets looked right through what was expected to be a wrenching process. We view that take as simplistic, in fact the Treasury curve is 40bp higher, the S&P Regional Bank ETF fell 8.2%, the Russell 2000 is underperforming the S&P by 5.5%, while the S&P 500 Information Technology and Communication Services sectors both rallied more than 10%. In other words, the unstable equilibrium between the rate insensitive household and large nonfinancial corporate sectors on the one hand, and inverted yield curve sensitive regional banks and their real estate and small business customers on the other, has persisted for nearly a year. For our part, we continue to lean into the unstable equilibrium: we are underweight duration, financials, small caps, rate sensitives and defensives sectors and long technology and related sectors along with industrials, energy and materials. This week we got our first acknowledgement from an FOMC participant (see below) that the Fed’s reckless accommodation in ‘21 and clumsy tightening in ‘22 and ‘23 that caused the deepest yield curve inversion since Volcker’s policy did irreparable damage to the Savings & Loan industry.
In this week’s note we update our bills only Fed balance sheet outlook, ‘Quadrilemma’ thesis ahead of the February employment report, update our inflation outlook, and look at the strength of the recovery in earnings from the 4Q22-2Q23 earnings recession. Our director of research, at Barclays, Stu Linde (RIP), would scold us for covering this much ground in a weekly note, but we had a lot to say.

Inching Towards a Bills Only Policy
We received two FOMC participant speeches this week pointing towards our thesis that the Fed will attempt return to the ‘bills only’ policy in place from the ‘50s through the early ‘00s. This is an element of our secular view that the 39-year bond bull market ended in 2020 and we have entered into a long-term bear market.
Guideposts for a New Central Banker, Jeff Schmid President and Chief Executive Officer Federal Reserve Bank of Kansas City
1. First, maintaining a large portfolio of long-term Treasury and mortgage debt can create distortions in the price of assets and the allocation of credit. These distortions risk misallocations that can ultimately sow the seeds of future imbalances in the economy.
2. Second, a persistently large balance sheet can have unintended consequences on the structure of the financial system. In making asset purchases, the Fed is lowering longer term interest rates and flattening the yield curve. Failure to unwind these purchases can challenge the ability of banks to borrow short and lend long. This is the business model that many community banks rely upon. And the Fed’s sizeable overnight reverse repo facility may have unintended consequences on the allocation of liquidity and the role of depository institutions in the economy.
3. Third, maintaining a large balance sheet can give the uncomfortable impression that monetary and fiscal policy are intertwined. As we’ve seen of late, a large balance sheet exposes the Fed to operating losses. And maintaining an excessively large Treasury portfolio offers the impression that the Fed’s balance sheet is supporting government debt markets. Over time, both have the potential to threaten the Fed’s independence.
Thoughts on Quantitative Tightening, Including Remarks on the Paper "Quantitative Tightening around the Globe: What Have We Learned?", Governor Christopher J. Waller
“Second, I would like to see a shift in Treasury holdings toward a larger share of shorter-dated Treasury securities. Prior to the Global Financial Crisis, we held approximately one-third of our portfolio in Treasury bills.13 Today, bills are less than 5 percent of our Treasury holdings and less than 3 percent of our total securities holdings. Moving toward more Treasury bills would shift the maturity structure more toward our policy rate—the overnight federal funds rate—and allow our income and expenses to rise and fall together as the FOMC increases and cuts the target range. This approach could also assist a future asset purchase program because we could let the short-term securities roll off the portfolio and not increase the balance sheet.14 This is an issue the FOMC will need to decide in the next couple of years.”
Labor Market Demand, Supply & Wage Growth Questions Abound
Until recently, the FOMC participant labor market narrative was something akin to “demand is softening, supply is recovering from the pandemic, which is leading to a more balanced market that is cooling wage growth to a level consistent with the inflation target.” Setting aside our analysis that at least half of the increase in wage growth was attributable to the year-long surge in reallocation (job switching) that began with the end of mobility restrictions in mid-’21, as well as our forecast for softer wage growth due to a reversal in reallocation, recent data implies a stall in the rebalancing process. For our part, we remain convinced that demand is weakening but the evidence is far from convincing and some ways from our quadrilemma thresholds of a 4% unemployment rate and wage growth below 4%. Our chart of small business employment measures below is reasonably convincing, except that none of these surveys have a great historical record for aggregate employment indicators. Incoming data this month has been mixed; initial and continuing claims for the establishment survey week increased to 202,000 and 1.905 million from 189,000 and 1.828 million, but these levels remain historically low. Regional Federal Reserve manufacturing and services surveys were marginally better in February but are close to the neither expanding nor contracting level. The Indeed job posting index continued to grind lower, suggesting a decline in job openings. Finally, the Conference Board’s Labor Differential (respondents characterizing jobs as plentiful less hard to get), was revised lower in January and dropped in February back to levels consistent with an unemployment rate above 4%. This survey had an extremely tight relationship with both the U3 unemployment and U6 underemployment rates pre-pandemic (.95 r-squared). It was working well as an indicator of the increase in unemployment in 3Q23, however, the bounce in this survey and stall in the increase in U3 could be explained by the drop in labor supply or seasonal adjustment factor smoothing issues attributable to pandemic including lower survey response rates.
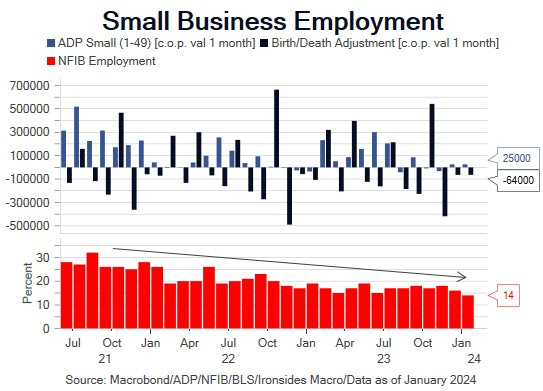
Other divergent measures of labor demand include state level unemployment rates and employment growth relative to national measures. Specially, state unemployment rates increased across a wide cross section of states in 4Q23, while the national measure did not. However, employment growth at the national level was lower than 3 of the 4 largest states in December. After the surprising increase in the January establishment survey (for the third consecutive January) that was not confirmed by the household survey, ADP report or NFIB Small Business Survey, we concluded that pandemic disruptions including a 450bp market share increase in ecommerce retail sales explained much of the upside surprise. That said, the recovery in corporate earnings, margins, capital spending plans, consumer demand for goods and resilient demand for services, suggest at least large corporate labor demand is unlikely to ease much in 2024.
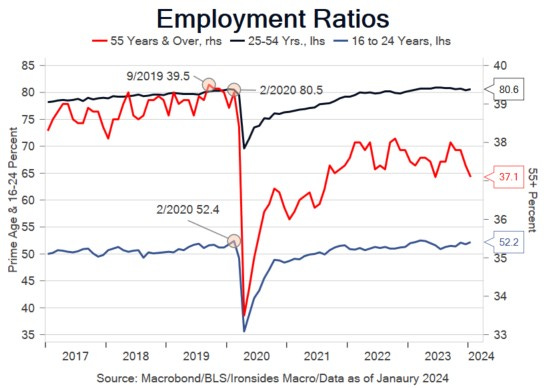
This brings us to the biggest shocker in the January employment report, the 2023 population control adjustment that declined by 625,000, following a one million increase in 2022 primarily attributable to prime age immigrants. The stall in the labor force participation rate is easily explainable, the prime age and 16-24 employment ratios are at the pre-pandemic levels. The 55+ employment ratio is 2.4% lower than late last cycle, and part of the decline is attributable to aging boomers, additionally, the increase in interest rates and wealth effects likely accelerated early retirements. The part of the story that doesn’t add up is the undisputable surge in immigration, perhaps that explains the convergence of the lowest to highest income quartiles, after the surge to the widest spread in June ‘22 (lowest 3.6% over highest) since the Atlanta Fed began their wage tracker series in the late ‘90s.
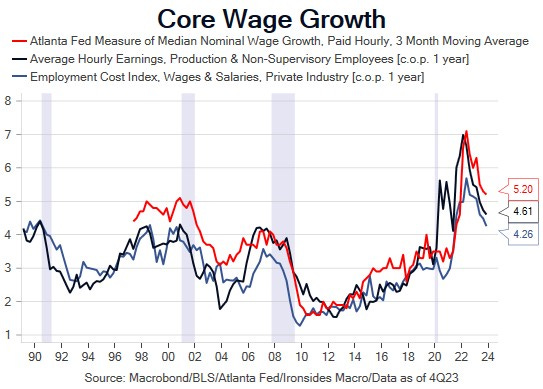
Until the stall in the 4Q23 stall in the unemployment rate and 2H23 recovery in labor supply, our thesis that falling labor market reallocation was forecasting a return to pre-pandemic wage growth looked sound, particularly after the 4Q23 employment cost index report showed private sector wages & salaries easing to 4.25% annualized from 4.49% in 3Q23. Additionally, the January Atlanta Fed Wage Tracker cooled across all of their sub-categories, despite three months of above-trend increases in average hourly earnings. Given well known compositional issues with the average hourly earnings series, we would typically dismiss the series except that the increase is being driven by service providing industries and both CPI and PCED non-housing services inflation accelerated over the same time period.

We tend to not spend time on issues where we lack conviction, and we just spilled a lot of ink raising more questions than we had answers for. We wouldn’t have walked through these questions about the demand for, supply of, and outlook for wage growth if it wasn’t so crucial for the monetary policy, and in a presidential election year, for public policy across a range of sectors (especially financial, healthcare and energy). The Bloomberg survey for the employment report has only a handful of estimates thus far, consequently these forecasts are subject to change. Currently, the median estimates are 190,000 increase in nonfarm payrolls following January’s surprising 353,000 increase and 126,000 upward revision to the prior two months. The unemployment rate is expected to remain at 3.7%, average hourly earnings are forecasted to cool to 0.3% from 0.6% and the work week is expected to rebound to 34.3 from the exceptionally low 34.1 in January, likely due to better weather. If those forecasts prove accurate, the FOMC’s March Summary of Economic Projections for ‘24 is unlikely to change much, however, there could be a couple of increases to the longer-run policy rate.

Inflation Outlook: P-Curve Comeback
Before we move on to the primary reason for the equity market advance, the recovery from the 4Q22-2Q23 earnings recession, let’s wrap up the January inflation data and outlook for the balance of 1H24. First of all, the Fed’s preference of PCED to CPI is reminiscent of what an astute portfolio manager observed, and we are paraphrasing, ‘econometrics was the worst thing that happened to economists. It caused economists to go from being generally correct to precisely wrong’. Another former colleague who now works at a macro hedge fund, Rob Bogucki, in Dean Curnutt’s Alpha Exchange podcast, described economists as being envious of physicists. PCED resolves a couple of statistical questions primarily related to substitution effects, CPI’s weights were only adjusted bi-annually until the pandemic when the BLS changed to an annual adjustment to the basket. On the other hand, BEA uses Medicare and Medicaid reimbursement rates for healthcare services, despite it being well known that physicians and hospitals are shifting costs to private insurers to compensate for below market rates. Additionally, with housing affordability at the worst levels since the ‘80s, CPI’s housing weight looks more appropriate.

Leaving the CPI or PCED debate aside, given our view that demand for labor is softening and the reallocation payback from the mid-’21 to mid-’22 Great Reallocation is likely to cool wage growth, we do expect some softening of non-housing services inflation. That said, this is the sub-section of inflation most likely to be impacted by the fiscal theory of the price level. We have made numerous cases for fiscal policy as the primary cause of the ‘70s Great Inflation and its role in the recent not-so-transitory inflation shock, but here is a new one that resonated with us.
A Fiscal Accounting of COVID Inflation, Joe Anderson, Eric M. Leeper
CONCLUDING REMARKS
The perspective on COVID inflation that the fiscal theory of the price level offers differs starkly from conventional views put forth by Fed policymakers, prominent macroeconomists, and economic journalists. Why? Conventional analyses embed a dirty little secret: future fiscal policy will always adjust as needed to fully back government debt with primary surpluses. By assuming that fiscal policy is self-neutralizing, conventional analyses assume away the issues this brief highlights. To sharpen the contrast between conventional views and ours, we posit that primary surpluses do not change at all. Reality probably lies somewhere between no surplus adjustments and full neutralization. How things play out rests entirely with elected officials. It is not a problem the Federal Reserve can fix on its own. If the COVID spending bills included legislation that adjusts taxes or other spending to pay for COVID relief, then we would not have seen inflation rise substantially. Bond prices would not have needed to fall to devalue debt. If Congress now were to adopt policies that fund increasing interest payments, we would be more sanguine about the prospects for getting inflation back to target. If fiscal policy continues to refrain from raising revenues or reducing spending and the Fed continues to combat above-target inflation with ever higher interest rates, there is little reason to expect inflation will return to prepandemic levels. You cannot extinguish a fiscal fire with only a monetary policy hose.

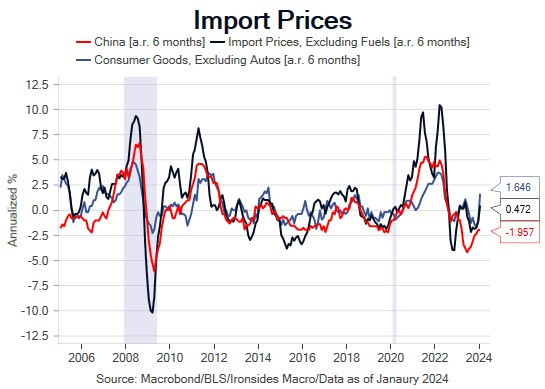
Prior to the January CPI, PPI and PCED reports we warned that the disinflation FOMC participants were so enamored with was overly dependent on goods deflation. As our next chart shows, the deflationary impulse from dollar strength during the August-October Treasury market bear steepening and Chinese manufacturing producer price deflation was likely to dissipate as global trade growth recovered. Additionally, although there is likely an easing of housing services disinflation in the pipeline, the Fed’s excessive easing primarily through asset purchases and asymmetrical tightening almost exclusively using rate policy, damaged the supply side of the housing market. This had the consequence of reducing the probability of a return to 0.25% pre-pandemic monthly increases from the current 6-month 0.45% rate. On the current path, 2-3 rate cuts in ‘24 are reasonable; however, this number of cuts is unlikely to be sufficient to disinvert the 3m10y banking model proxy yield curve. If the curve does disinvert with the policy rate near 5%, it is going to leave a nasty mark on bank securities holdings and tighten the credit channel further.
The Earnings Recession is Over, Long Live the Capex Driven Expansion
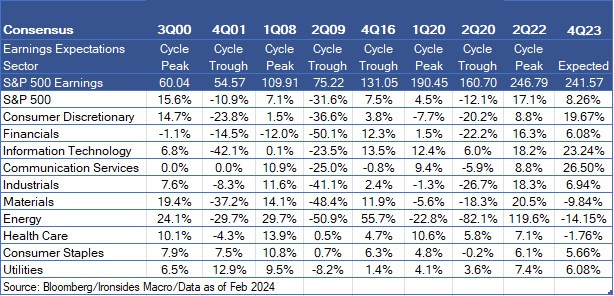
Our year-to-date focus on the inflation and labor market outlooks have likely created an overly bearish impression of outlook for equities, combined with a correctly bearish outlook for Treasuries. The 6.8% increase in the S&P 500, 8.2% decline in the S&P Regional Bank Index and 40bp year-to-date increase in 2-year Treasury rates is both similar to the first stage of the August to October Treasury bear steepening and renders the narrative that the equity market has ‘looked through’ the resetting of rate cut expectations, nonsensical. Our 1Q24 outlook base case was for a growth and earnings scare that set the stage for a ‘healthy broadening out’, with our second most probable outcome, a reset of policy expectations. Thus far, earnings look on track for double-digit growth, in other words, a ‘V’ shaped recovery from the 5-6% 4Q22-2Q23 earnings recession.
While the recovery in earnings is off to a decent start, it is concentrated in technology, consumer discretionary and communication services, the sectors we have been referring to as technology and related since the 2018 restructuring. We will have to wait another month to get the Bureau of Economic Analysis first cut at 4Q23 gross domestic income, the operating surplus of private sector enterprises, and corporate profits to get a broad guesstimate of the corporate sector including non-publicly traded companies. In the interim, Bloomberg’s calculation of S&P 500 earnings is +7.7%, while the S&P Small Cap 600 earnings fell 19.8% and Russell 2000’s earnings are contracting -18.6%. The inverted Treasury curve, level of rates for companies that cannot term out their debt, and tight bank credit is not the entire explanation for this divergence, additional factors likely include pricing power and lags in the pace of the recovery. However, there is little fundamental justification for small caps until and unless the Fed starts down a path towards a 4% policy rate in fairly short order.

Sector & Asset Allocation Update
Our primary takeaway from last week’s data was that the US manufacturing renaissance, currently aided by, though in the longer-run distorted by, modern supply side economics (industrial policy), continues to progress. The most notable revision in the second cut of 4Q23 GDP was structures investment revised from 3.2% quarterly annualized to 7.5%. The momentum continued in January, although nonresidential construction spending fell 0.4% from December, manufacturing spending increased 2.1%, following the prior 3 month increases of 0.8%, 5.5% and 1.9%, for a 36.6% year-on-year increase. The outperformance of US manufacturing relative to the rest of the world was evident in the domestically weighted S&P Global Manufacturing PMI at 52.2 from 50.7 in January, while the more heavily weighted to multi-national ISM Manufacturing Survey slipped to 47.8 from 49.1, a level consistent with PMIs from Europe and Asia. Additionally, the 6-month forward average of the five regional Fed manufacturing survey capital spending plans has rebounded 10 points after approaching the boom/bust line last fall to where it was at the beginning of the FOMC’s series of 75bp rate hikes. Industrials, particularly the construction & engineering and machinery industry groups, continued to move higher this week.
The February employment report is crucial to our macro-outlook that informs our asset and sector allocation. For now, we continue to lean into the unstable equilibrium.
Barry C. Knapp
Managing Partner
Director of Research
Ironsides Macroeconomics LLC
908-821-7584
bcknapp@ironsidesmacro.com
https://www.linkedin.com/in/barry-c-knapp/
@barryknapp


