Labor Demand Convexity
Not so plentiful jobs, no more surplus of demand, maximum U3 rate convexity, lower hiring, quits, and churn, cooler wage & productivity growth

(BN) FED: FOMC ATTENTIVE TO 'RISKS TO BOTH SIDES' OF DUAL MANDATE
(BN) POWELL: DON'T WANT TO SEE MATERIAL FURTHER COOLING IN LABOR MKT
(BN) POWELL: LOOK AT PRIVATE LABOR DEMAND EXTRA CAREFULLY
(BN) POWELL: REAL DISCUSSION AT MEETING ABOUT CASE FOR MOVING TODAY
(BN) POWELL: AWARE OF SAHM RULE, CALLS IT A `STATISTICAL REGULARITY'
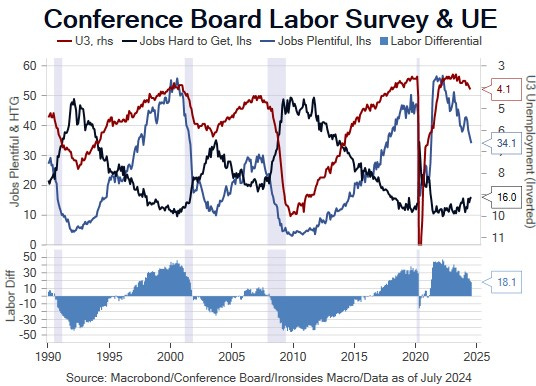
Jobs Not So Plentiful
Chair Powell’s hypothetical scenario that would lead to a 25bp September cut; no unexpected weakness in the labor market or economic output and no change in the trend of inflation, suggested as long as the July and August core CPI and July core PCED readings were less than or maybe equal to 0.3%, they would cut. Our view is there are a series of data points that could lead to the FOMC beginning the process with a 50bp cut. Those data points begin on Friday with the July employment report and include the initial estimate of the annual benchmark revision just prior to the Jackson Hole Economic Policy Symposium, the first revision to 2Q24 GDP on August 29, and the August Employment report on September 6. This note will preview Friday’s report and discuss our view that Chair’s labor market ‘normalization’ is perilously close to a nonlinear increase in the unemployment rate.
Tuesday’s July Conference Board Consumer Confidence and June Job Openings & Labor Turnover Surveys as well as Wednesday’s July ADP Employment Report and 2Q24 Employment Cost Index strengthened our conviction that the increase in the unemployment rate from 3.4% in January ‘23 to 4.1% in June ‘24 isn’t just attributable to increased supply, demand has weakened and appears to be at its maximum point of convexity. In other words, any further decrease in demand is likely to drive the unemployment rate up at an accelerating rate. The Conference Board began their survey in 1967, not quite as long as the Bureau of Labor Statistics has been conducting the household survey, but a decent sample set. The relationship between the labor differential, respondents characterizing jobs as plentiful less those calling them hard to get, was exceptionally strong pre-pandemic, and over the last year the relationship is reasserting itself. In July, the labor differential was 18.1% and the June reading was revised sharply lower from 24.0% to 19.8%. When the unemployment rate hit its low in 1Q23, the labor differential was 40.7%. In July it hit the lowest level since full lockdown mode in March ‘21 when the Biden Administration, Yellen Treasury, Federal Reserve and Democratic Congress were pumping the economy full of stimulus. In December ‘19, the labor differential was 33.5%. In early 2017 the labor differential was at the current level, and the U3 unemployment rate was 4.3%-4.4%. If we use the pre-pandemic ‘out of sample’ regression relationship, the labor differential implies an increase to a 4.26% rate, if we include the data since March ‘20, the regression line implies a 4.42% rate. The FOMC Summary of Economic Projections June forecast for the year-end ‘24 U3 rate was 4%, another uptick would certainly qualify for ‘unexpected weakness’ in the labor market and warrant a policy response.