Inflation Mythology
Revisiting the Great Inflation, hot CPI comps
Macro Risk Advisors Announces Formation of Ironsides MRA Institutional
Inflation Mythology
History is a pack of lies we play on the dead. — Voltaire
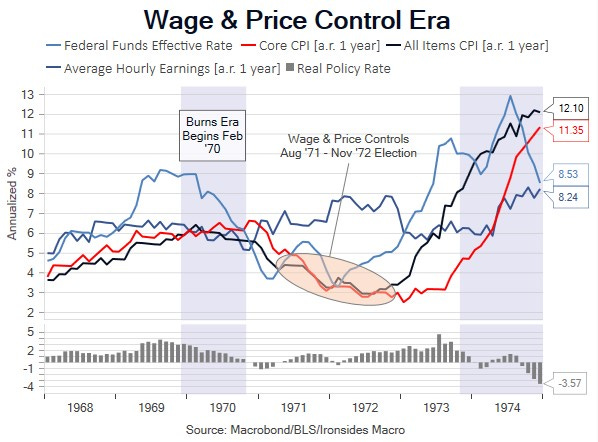
Inflation is the responsibility of the Fed. The stop/start policies of the Fed in the 1970s caused expectations to become unanchored until the Volcker Fed crushed expectations by focusing on the money supply, driving rates to 20% and the unemployment rate to 10.8%. This oversimplified narrative is a source of risk to both the near and longer run welfare of the US because it absolves fiscal policy of any responsibility for inflation. The policy responses to the financial crisis relative to the pandemic (measured fiscal response in ‘09, excessive in ‘21) provides clear evidence that monetary stimulus primarily causes asset inflation, while fiscal stimulus has direct impact on consumer price inflation. Monetarists and Austrians write often about the role of the Nixon Administration’s decision to end gold convertibility and later end the Bretton Woods exchange rate regime as an important contributor to the Great Inflation. Both of these narratives ignore the highly cynical wage and price controls that were launched alongside the August 1971 end of dollar/gold convertibility. The Democratic Congress passed the Economic Stabilization Act of 1970 providing Presidential wage and price control authority. Nixon had served on the price control board during WWII, he was on record against this economic abomination, yet he exercised his authority and rode the transitory disinflation to a landslide reelection in November 1972. The bottom in CPI was uncannily close to the election. Then the CPI doubled in 8 months and quadrupled in 24, a deep recession began in November 1973, and the policy was abandoned in 1974. We suspect a Democratic policy, implemented by a Republican President, suppressed criticism by prominent economists of the day. We looked at Milton Friedman criticisms of President Nixon’s role in expanding the administrative state (EPA in particular), but we didn’t find anything about wage and price controls. Nor could we locate any commentary from F.E. Hayek about Nixon’s wage and price controls.

Bill Martin turned over the Chair of the Federal Reserve to Arthur Burns with the economy in recession and a policy rate 4% above CPI. The Martin Fed was leaning against inflation that averaged 1.3% in the first half of the ‘60s, before beginning a steady rise to 6% led by medical care services following the passage of Medicare and Medicaid. LBJ’s Great Society spending and his later attempt to tax his way out of growing deficits are eerily similar to the current policy mix. The Burns Fed was tightening policy in 1971, the policy rate was 5.75% and CPI was 4.4% when Nixon launched his economic malpractice, they eased to 3.5% alongside the transitory disinflation, then tightened to 11% by late summer 1973. The unemployment rate was stable near 6% through ‘71, fell to 5.2% by the end of ‘72, continued lower to 4.6% by October ‘73 the month before the NBER recession began, then increased to 9% in May ‘75, two months after the end of the recession. Tell me a story daddy about how stagflation was the Fed’s fault. LBJ’s Great Society kicked off the Great Inflation, and the wage and price controls were disastrous. Blaming the Great Inflation on Arthur Burns is convenient, but also appears to be a pack of lies played on the dead.
For more on this period see Inflation as a Fiscal Limit, highlight pages 22-24 and Arthur Burn’s The Anguish of Central Banking

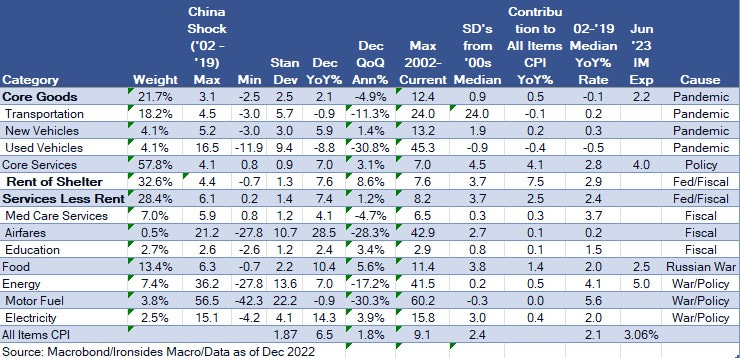
Chairman Powell’s DC Economics Club discussion on Tuesday, while similar in tone to the press conference, promulgated the Fed responsibility/fiscal absolution narrative. Curiously, within his inflation framework he continues to describe goods inflation disinflation as well underway, rents disinflation as only a matter of time, but services less rent of shelter inflation as not yet disinflating. This is curious given that on a 6-month basis CPI services less rent of shelter slowed from 10.7% in June to 4% in December. On a 3-month annualized basis, underscoring the disinflationary momentum, it fell from 12.2% in June to 6.7% in September and 1.2% in December. As we discussed last week, Powell’s labor slack models (Beveridge and Phillips Curves) for services inflation are inefficacious at best, if not downright misleading. There are plenty of Fed papers attributing a larger proportion of inflation in the US to demand, generally 50%, and there is little doubt that demand was turbocharged by excessive fiscal stimulus. Consequently, when Chairman Powell and other FOMC participants state that the disinflation process hasn’t begun in services, they are implicitly absolving fiscal policy.
NY Fed President Williams was even more direct in response to a question prior to the last meeting, absolving fiscal policy inflation attribution. As Fed Chair Martin stated when the costs of LBJ’s Great Society were being distributed to the general public in the form of inflation, ‘the Fed is independent, within, not of the government’. The party that was in control of the White House and Capitol Hill until November passed a significant amount of legislation that the Treasury Secretary coined ‘modern supply side economics.’ These policies expanded the role of the federal government, and there is a growing portion of the opposition party that supports this expansion, as in the ‘60s and ‘70s. The structure of the Federal Reserve leaves them little choice but to take fiscal policy as a given and to do their best to offset any the inflationary impulse created by those policies. The real lesson of the ‘70s is that the Fed cannot solve the problem themselves. In the coming decade, the end of the Chinese labor supply shock, deglobalization, energy policy and fiscal policy are all likely to contribute to significantly higher trend inflation than the ‘00s and ‘10s. We may not see the effects in ‘23, but we are convinced that fiscally driven inflation will be with us throughout the ‘20s.

CPI Preview: Comps Getting Hotter
Focusing on annualized comps and the impact on annualized change is not our preferred approach; however, when the Chairman fails to acknowledge 3- and 6-month rates of change and the FOMC hiked their policy 75bp at four consecutive meetings even as breakeven inflation and realized shorter term measures were cooling fast, the policy reaction function is clearly sensitive to annualized inflation rates. With that in mind, in the monthly changes in January ‘22 for all items CPI was .65%, core .58%, core goods 1.0% and core services .44. The all-items comps get even hotter in February (.80%) and March (1.24%) due largely to food and energy prices, though airfares, apparel, lodging, medical care services, recreation and furnishings will also be lapping surging inflation. One important note: BLS changed their weighting rebalancing from biannual to annual, so beginning this month there will be new weights based on 2021 consumption. This implies a greater weighting for goods given that goods consumption was well above trend, and services consumption had not yet fully recovered. Expectations are for an uptick from the 4Q average all items monthly change of .13% to .5% and core from .27% to .3%. January PPI (Thursday) is also expected to pick up to .4% from -.5% in December, core consensus is .3% from .1% in December. Import prices (Friday) are expected to decline .1% following a .4% increase in December. Looks like a lot of mean reversionism modeled forecasts.

There have been some signs of stabilization in goods prices, December import prices quarterly annualized turned up, likely due to the dollar reversing course. The Manheim used car price index increased in December and January leading to a tepid reversal in the annualized rate from -14.9% in December to -12.8% in January. New car prices are more likely to slow further, given the loosening of supply. While goods prices are lapping hot comps (as we have discussed at length) we believe the inventory destocking process and rebalancing of goods and services are complete. Consequently, the maximum disinflationary impulse in shorter term momentum measures, like the 3-month annualized rate, are probably behind us. In the longer run we do not expect a return to the nearly two decades of zero core goods prices, but in the near-term Asian exports are still contracting and the China reopening is likely to contribute to goods disinflation.

Moving on to Chairman Powell’s sticky services less rent of shelter CPI, with the exception of February, the comps are white hot due to the surge in demand for services in 1H23. Monthly changes for January through June ‘22 were .93%, .41%, .87%, 1.06%, .87% and 1.09%. The average monthly change for this series in 2H22 was .33%, though the standard deviation was reasonably high at .39%. Major components in this series are transportation, medical care, education and recreation. The only one of these categories with positive momentum is education. Assuming the 2H22 rate persists in 1H23, the annualized rate of services less rent of shelter will fall from 7.43% to 4.03% in June. Were the 4Q22 0.1% pace to persist, this series would cool to 2.57%.

The January employment report triggered a 40bp increase in the 2-year Treasury yield and saw the S&P 500 back below 4100, an important technical level that stopped the rally off the October lows in early December. Implied volatility for S&P options jumps from 16% to 23% the day of the CPI release. CPI is not the only economic indicator of importance next week; January retail sales are expected to rebound sharply from the soft November and December readings as they did the prior two years likely due to pandemic related seasonal adjustment factor issues. The first two February regional Fed manufacturing surveys are important to our view that the inventory destocking process is winding down. The January PPI report will be preceded by the annual revisions. We also get the January housing starts report and February NAHB Housing Market Index, recall in January the NAHB Index bounced 4 points after a relentless year-long decline from a white hot 84 reading to deeply contractionary 31 level in December.

Key Investable Themes & Asset Allocation:
Deglobalization & Capital Spending Boom: Industrials XLI -0.14%↓
Resilient Growth: Materials XLB 0.22%↑, Financials XLF -0.97%, KRE -0.14%↓, Energy XLE -0.86%↓ XOP -0.67%↓, Small Caps IWM -0.40%↓
Technology Innovation Diffusion: Healthcare IYH 0.00, Industrials XLI -0.14%↓ and Financials XLF -0.97%↓
Global Equity Allocation: Overweight US and UK equities SPY -0.38%↓, EWU 0.00, underweight export dependent economies (China FXI -1.20%↓, Germany EWG -0.48%↓, Japan EWJ -0.34%↓)
US Asset Allocation: Overweight equities SPY -0.38%↓, underweight Treasuries TLT 1.16%↑, overweight credit LQD 0.09%↑
Portfolio Hedging: Equity index skew (downside puts) is cheap. Upside equity calls are highly correlated, consequently speculative call positions ahead of macro catalysts like CPI, ECI and the next Fed meeting are likely to perform well.
Slower tightening: MORT 0.40%↑, TLT -0.28%↓ puts
Barry C. Knapp
Managing Partner
Director of Research
Ironsides Macroeconomics LLC
908-821-7584
bcknapp@ironsidesmacro.com
https://www.linkedin.com/in/barry-c-knapp/
@barryknapp


