Inflation Forecast Shortfall
The yield curve signals screams ease, inflation is not near the Fed's forecast, the tariff tax effect on spending, China's deflationary vortex, small caps moving higher
The Signs are Clear
A new candidate for Fed Chair, Marc Sumerlin, gave an interview on Bloomberg Surveillance on Friday where he suggested the Fed staff is currently organized like a university academic research department focused almost exclusively on economic modeling. His idea was to split the staff into three equal weighted groups focused on economic modeling, sectoral expertise and a markets group. We like the approach. The lack of markets expertise on the Board, the FOMC and the staff, even while the Fed’s bond portfolio reached 35% of GDP, leading to massive losses and capital misallocation, has received a remarkable lack of political scrutiny and criticism from the economics community. The investor community has a very different view.
The FOMC’s reaction to the Trump Administration’s tariffs is another example where the ability to read the signs from the markets could have helped, a deeply inverted breakeven inflation curve, and plunge in stocks in early April was an unmistakable signal that tariffs are a tax, not an inflationary shock. As we listened to another professor turned FOMC participant discuss this week’s inflation reports our eyes shifted from CNBC to our Bloomberg rates page, breakeven inflation rates are lower for the week, and most notably, the 1-year breakeven inflation rate is ~75bp below the June Summary of Economic Projections median implied forecast for CPI (derived using the historical CPI less PCED spread). Every time Chair Powell says every forecaster he knows is expecting hotter inflation we scream at the screen, except the most important one, Mother Market.
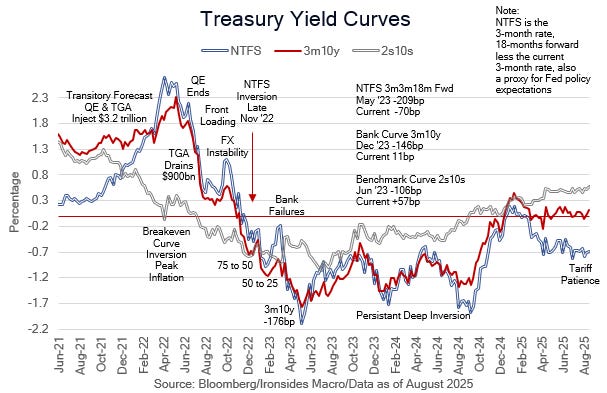
The signs from the various yield curves we watch closely, the benchmark 2s10s curve, the near term forward spread, the banking proxy 3-month-10-year and 5s30s, are clear, it is time for the Fed to ease policy. Meanwhile, at the Eccles Building and the regional banks around the country the economic modelers seem to have convinced their bosses they have the power to return inflation to 2% using their interest rate policy tool, even as their balance sheet continues to suppress term premium and keep conditions looser than optimal for asset owners and high-quality fixed rate borrowers (see the headline below). The real Fed blind spot is the role of fiscal policy, and government spending in particular. This week we learned that after the prior administration’s blow-out, the rate of spending has returned to its 70-year median growth rate of 6.5%. As we continue to emphasize, falling inflation volatility and correlation are compelling signs fiscal and monetary policy are restrictive. This week’s reports reduced those measures further.
(BN) SAFEST US CORPORATE BOND SPREADS TRADE AT FRESH 27-YEAR LOW
We suspect Chair Powell is going to pass on signaling a return to policy rate normalization after 8 months of ‘patience’ in his Friday Jackson Hole address. More likely his last Jackson Hole speech will target what he hopes will be his legacy, protecting the institution’s independence. With no inflation or employment data on the agenda for next week, the FOMC minutes and Jackson Hole Economic Symposium, with a modest diversion to retailer earnings, are likely to leave the markets feeling frustrated (lower) by the time we publish next week’s note.
This week we review the inflation reports, the impact of tariffs on retail sales, earnings, revenues and margins for consumer facing companies, China’s global deflationary impulse, small caps and system liquidity as the Treasury increases bill issuance.


