

Gaining Traction: It's Never Different
Policy slows the run on capital markets and analysis of equity market downside risk

The response to last week’s note was incredibly strong, consequently we are going to make this note available for our free and paid subscribers. If you found the note useful, please become a subscriber. We will return our full notes to behind the paywall soon.
Most of this week’s note focuses on business cycle and equity market valuation analysis that leads us to conclude Monday’s low in the S&P 500 fully discounted the Coronavirus Contraction¹. We followed the recommendations we made last week and bought software and healthcare equities Monday morning. The monetary and fiscal policy response to the crisis, while not without long-term costs, was successful in stopping the run on capital markets and the nonbank sector. The recovery began at the core of the financial system with inflation breakeven rates rising, real and agency mortgage-backed security rates falling. Fixed income volatility contracted sharply. From the peak on March 19, the yield on the Fannie Mae current coupon security dropped from 2.72% to a cycle low of 1.54%. A 3% 30-year fixed rate mortgage is possible. The financial market stabilization broadened to investment grade secondary and primary markets and later high yield credit. Finally, and perhaps most significantly for the global economy, the dollar ceased its relentless rally and retraced back to its pre-crisis range, though emerging market currencies remain depressed.
The Fed had the playbook from the global financial crisis and with the help of Treasury, has some additional weapons at its disposal. Still, even with the rally, signs of stress in the nonbank sector, particularly residential real estate lending including mortgage REITs, servicers and originators, remain under pressure. As we were writing this note, a headline appeared on Bloomberg that the government was weighing a ‘lifeline for mortgage servicers on Ginnie Mae bonds.’ It seems in the regulators haste to reduce risk to the taxpayers by pushing the banks out of the mortgage market, they made the system more unstable. As an aside, we would like to know whose decision it was to announce a cut in Fed daily asset purchases at 3:40 on Friday afternoon as the S&P was grinding back from early losses towards unchanged. Much of the effect of the end of the run was attributable to market participants belief that the Fed would do whatever it took. The announcement was poorly timed and ill-advised.
¹https://ironsidesmacro.substack.com/p/the-corona-contraction
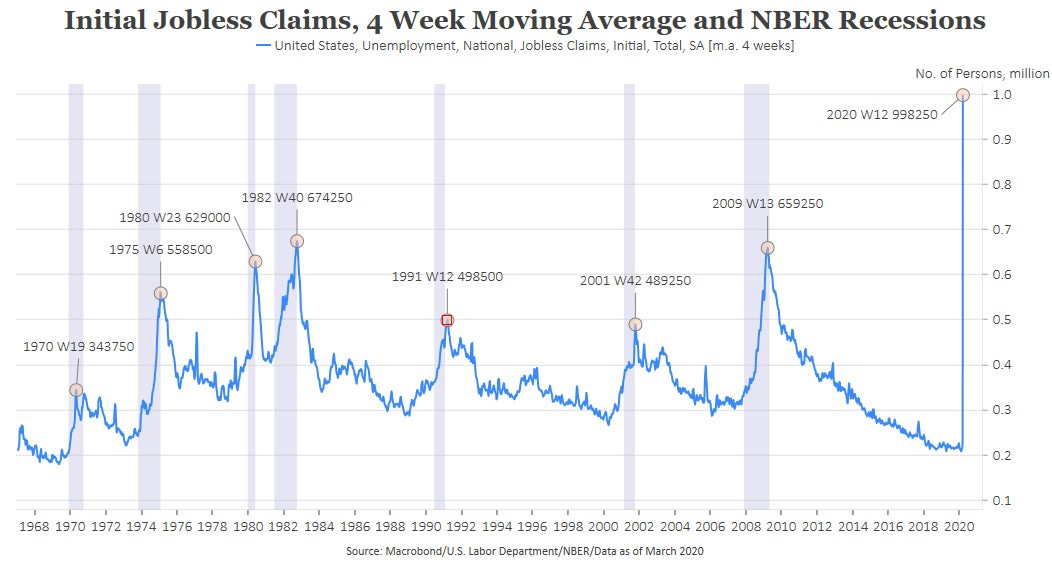
Figure 1: We were hoping for an expansion of eligibility and increase in benefits in this front line automatic stabilizer. GOP objections were missed placed provided this program is phased out after the crisis ends and the recovery begins.
As impressed as we were with the Federal Reserve actions to stabilize the run on the capital markets, the unprecedented speed that the pandemic relief bill known as the Cares Act passed Congress was astonishing. We wrote in our March 7 note “Bank Repression“² that the 2011 deals that resolved the debt ceiling showdown offered a model of how a crisis could force a solution. Though we expected a bipartisan deal the speed and scope of this deal exceeded our expectations. We have long believed that the balance of power between the branches of government is a pendulum that was close to an apex of presidential power. The power of the presidency peaked with Nixon, shifted towards Congress until 9/11, when Congress began passing legislation that did little more than acquiesce additional power to the executive branch. The Patriot Act, The American Recovery & Reinvestment Act, Dodd Frank Wall Street Reform, and the Affordable Act all granted significant discretion to the executive branch and expanded what Hayek called the ‘Administrative State’. The construction of the Cares Act, five bipartisan working groups of Senators, and passage in a little more than a week, may mark an inflection point in the balance of power particularly if it proves successful.
²https://ironsidesmacro.substack.com/p/bank-repression
We will spend more time on details of the law in coming weeks, however we want to make an observation about the section that provides funds for small business loans, defined in the law as those with less than 500 employees, that transition into grants. We received considerable feedback on our table in last week’s note that showed employment, income and turnover by sector. With all the attention on the net change in monthly payrolls, and excitement created by a 300,000 monthly increase which represents 15bp of total employed, market participants and economists are deceived into the belief that the labor market is far more stable than the Jobs Openings & Turnover Survey data reveals. Every month there are ~5.9 million hires and a similar number of separations. Multiply the sum of hires and separations by three and divide by total employed, and worker reallocation is 25%. With that in mind, our next chart shows that the most dynamic companies are those with 50-249 employees, followed by those with 10-49 workers. These are the companies targeted in section 7a) Small Business Association loans, administered by local banks that if employment conditions are met, are forgivable. These companies are run by resourceful, entrepreneurial individuals and we suspect they will find a way to recover more quickly than most economists and investors expect. Large companies are the least dynamic, and probably can deal with all the constraints placed on them if they require government assistance, because they are already similar in their operation to the public sector.
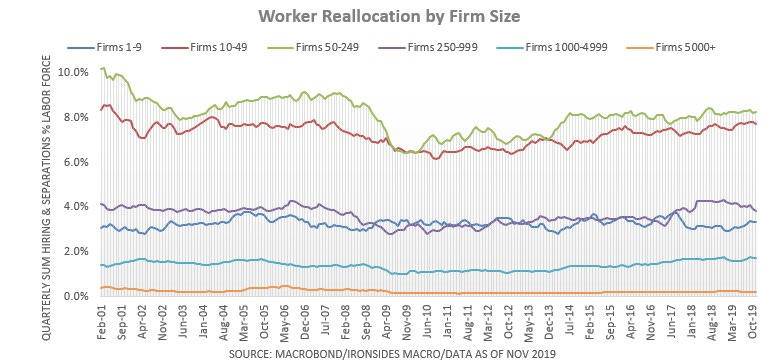
Figure 2: This is slightly different calculation than we showed last week, the divisor is total employment, rather than the employment in each sector. For example hiring and separations of employees by firms with 50-249 employees is 8.25% of total employment per quarter while turnover in firms with 5000+ employees is 0.24%.
Monday’s Low Fully Discounted a Post War Recession
While the financial media and strategists conclude that the bear market cannot be over because of the looming recession, or until the number of new coronavirus cases peak, we want to remind our readers that the S&P 500 is a leading, though at times misleading, economic indicator. When we launched our equity strategy product at Barclays in October 2008 after the TARP bill passage and market rally, our key forecasts were a 50% drop in S&P 500 earnings bottoming in 3Q09, and a retest of the 750 low, with the market bottoming in March. Ultimately, earnings bottomed in 3Q09, the recession ended in June and the equity market bottomed in March. The 6-month lead of the bottom for prices relative to earnings, has persisted through the post-war history and in the mini-cycles since the financial crisis.
This of course leads to the question of timing of the peak of the outbreak, easing of population-based controls and end of the recession. Vice President Pence reported on Friday 500,000 tests had been administered and a point-of-care test was imminent. While questions persist about the effectiveness of population-based controls given differences in the states, a mid to late-April peak still appears to be the most likely outcome. With that in mind, we reject the idea that the market cannot make a bottom until the cases peak, markets respond to the rate of change (second derivative), consequently it is the slope of the curve and visibility about the timing of the peak. We believe the coalescing of the view that mid to late April is the most probable was a major contributing factor to the rally this week, along with monetary and fiscal policy.
Last weekend, in response to our note last week, we were asked by a client for our downside target for the S&P 500. We spent Sunday morning analyzing past business cycles, valuation and checked our work with a bit of technical analysis. We concluded that 2150 would fully discount all but an exogenous shock like the ‘73-’75 OPEC Embargo that damaged the global economy for the rest of the decade. The following morning S&P futures traded down to 2174, before bouncing sharply. The feedback on our process from the client was favorable and given the debate about whether Monday’s low was the bottom, we think it makes sense to provide the analysis to our clients.
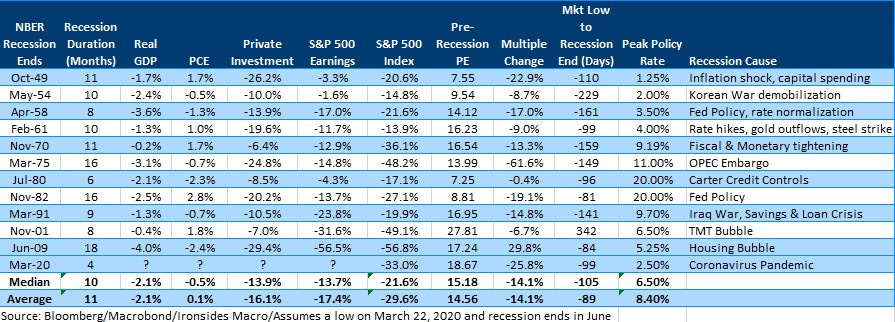
Figure 3: Perhaps the most notable characteristic of post-war recessions is the collapse in investment and resilience of consumer spending. The largest single quarter declines were -10% in 1Q58 and -8% in 2Q80, these are the sudden stop, and shortest, recessions. It is notable that these recessions also had two of three largest declines in consumer spending. If Monday was the bottom for the S&P 500, and the recession ends in June, both big ‘ifs’, the timing and magnitude of the decline is right in line with history.
Business Cycles
We were looking for an 8-10% pullback in April/May when the Fed was expected to end ‘Not QE’. We believe QE elevates valuations of bond-like stocks by depressing real rates, but does not do much for economically sensitive cyclicals. Still, if we assume 8-10% of the drop is attributable to Fed related overvaluation, and the balance to the ‘Corona Contraction’ (recession), the month-long 35% peak to Monday’s low, the recession-related decline is closer to the high end of the median and average declines associated with a recession, at 25-27%. The pre-recession PE ratio that was near the high end of prior recessions at 18.7, is consistent with our view that a portion of the correction is attributable to stretched valuation.
We do not believe that the likely duration and long-term implications of the mandated shutdowns warrant a 50% drop like the 73-75 OPEC Embargo Recession or similar declines associated with the Tech or Housing bubbles. As we wrote last week, it is certainly possible that policymakers do not properly balance the health risks with economic costs, but the economy is more dynamic than the dire economic forecasts imply. In fact, the two ‘sudden stop’ recessions, with the deepest quarterly declines, were 1Q58 -10.0% and 2Q80 -8.0%. As you can see from the table, the earnings and price declines associated with those recessions were less than average.
Business Cycle Target: 2175-2210
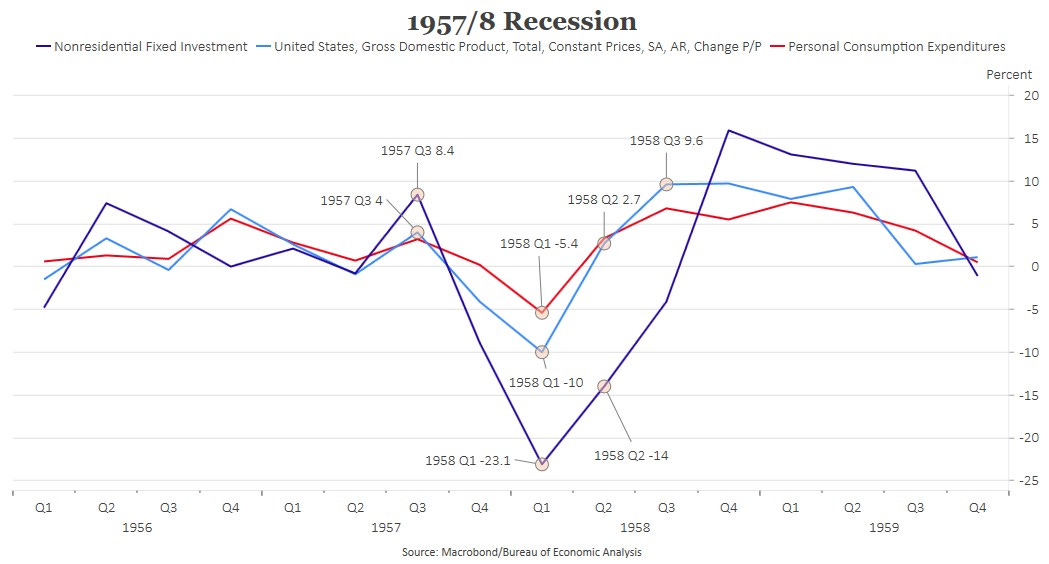
Figure 4: We spent time reviewing the 1957/8 recession after a client sent us a note from Brian Wesbury attributing this ‘sudden stop’ short sharp global recession to the Asian Flu pandemic that reportedly took 1-2 million lives globally and ~70,000 in the US. We looked at the data and reviewed some research including reading FOMC minutes, it is an interesting analog but other than the global nature of the recession and virus, as well as larger than typical drop in consumption, we could not find much direct evidence linking the recession to the virus. Most literature, including Friedman’s “A Monetary History of the United States” focuses on monetary policy.
Valuation
We heard a number of strategists state that valuation was of little use due to a large confidence interval around the ‘E’ in PE. In our view valuation is of little use mid-cycle; however it matters most at peaks and troughs, but like most market dynamics, it is the rate of change that matters. Prior to Monday’s early decline, the multiple contraction of 19% was already as large as the 1981-82 recession when the unemployment rate reached its post-Great Depression high of 10.7%. At the lows, the multiple contraction of 26% was the second largest and the absolute level was 1.2 standard deviations below the 30-year median.
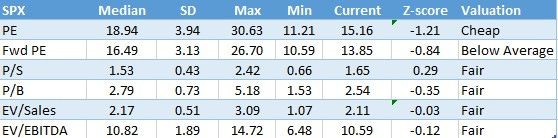
Figure 5: This data in this table begins in 1989 when the economic sectors were created. The market is 1 standard deviation cheap to trailing and forward earnings and marginally cheap to book. There is a strong case that book value is understated due to the surge in intangible investment, particularly the technology sector.
The level of the equity risk premium may not have much forecasting value in the short-run, however, given the growth in target date asset allocation strategies and pension fund strategic asset allocation targets, the relative valuation of equities and longer duration Treasuries is likely to drive assets back into equities. Already there has been evidence these rebalances are providing support to equities. An important contributing factor this week to the discount rate for equity earnings and market functioning, was the sharp increase in market-implied inflation, known as inflation breakeven rates, and the sharp drop in real interest rates. The equity risk premium is compelling at these levels.
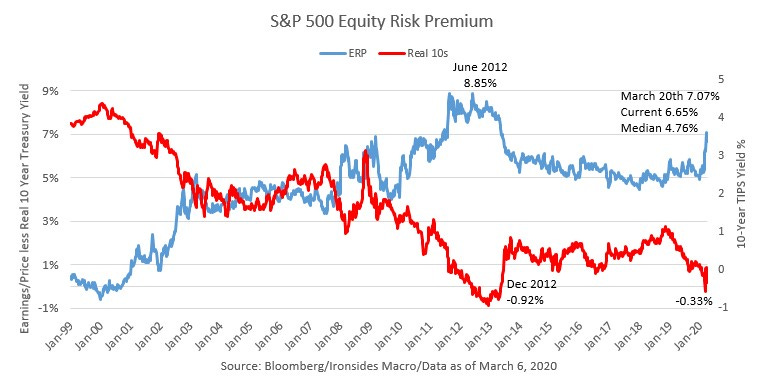
Figure 6: The equity risk premium is exceptionally elevated, with the underlying risk free asset stabilizing we expect strategic asset allocation driven investors, like pension funds, to rebalance into equities.
Valuation Target: 2150
We rarely write about technical analysis, yet we always look at the chart with a focus on patterns, before we trade or recommend ideas to clients. With that in mind, it would not have shocked us if the equity market had tested the top end of the 2015-16 range during the oil price collapse, Chinese heavy industry hard landing, and S&P earnings recession, at 2100. Consequently, combining our business cycle, valuation and technical analysis, we think 2150 should represent downside risk for the S&P 500, implying it is probable that the low of the Corona Contraction was on Monday March 23.
Policy Transparency
A policy consultant once told us with respect to monetary policy communication, ‘transparency is good as long as you know where you are going’. The Fed’s decision to announce on Friday afternoon they were reducing their purchases was unnecessary transparency that ended a week of impressive stabilization of financial markets on a down note. To be sure, while the policy steps have been impressive, and expectations for the peak of the new virus cases has been relatively stable, significant questions remain about the mortality rate, ability of the healthcare system to treat patients, success of the population-based virus control measures, and progress in developing therapeutics, not to mention the magnitude of the economic impact. As long as the US remains in the accelerating, steepest phase of the new cases curve, sentiment is likely to be tenuous. Our view that Monday’s low is the right level both in terms of the magnitude of the correction, as well as the timing relative to when the economy is likely to begin its recovery, does not imply there will not be some anxious moments. Still, we think you should be adding risk on corrections and would favor healthcare, software and financials.
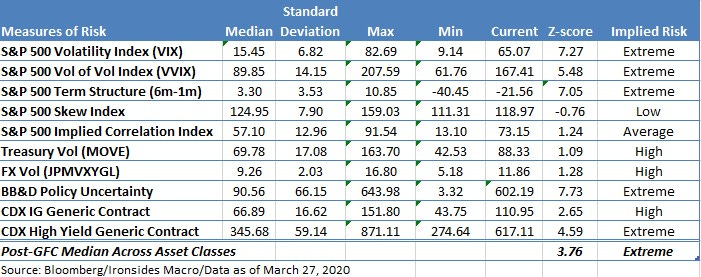
Figure 7: The level and shape of the VIX futures curve remains extremely elevated. The most significant change this week was the sharp drop in fixed income implied volatility. Credit spreads tightened, and the investment grade credit channel reopened. Nevertheless, market measures of risk on balance remain at extreme levels.
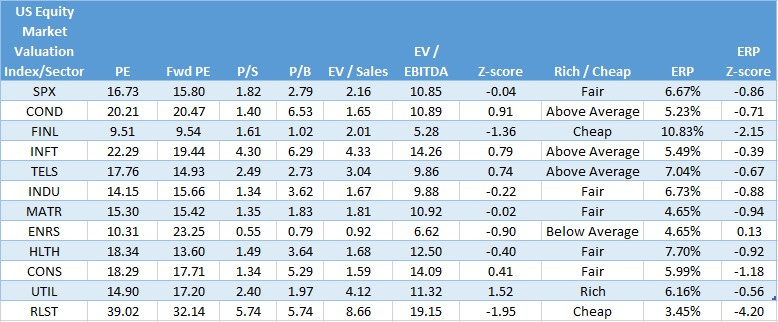
Figure 8: The sector that stands out as exceptionally cheap are financials. We long believed this sector needed to perform well through the next recession to regain investor trust after the Global Financial Crisis sector collapse. We are buyers.
Barry C. Knapp
Managing Partner
Ironsides Macroeconomics LLC
908-821-7584
https://ironsidesmacro.substack.com
https://www.linkedin.com/in/barry-c-knapp/
@barryknapp
Reading List - The first book on the list discusses the role of disease in the Columbian Exchange. You might find it particularly insightful now.
“1493, Uncovering the New World Columbus Created”, Charles C. Mann
“Great Society, A New History”, Amity Shlaes
“The Second Machine Age”, Erik Brynjolofsson, Andrew McAfee
“Showdown at Gucci Gulch, Lawmakers, Lobbyists, and the Unlikely Triumph of Tax Reform”, Jeffrey H. Birnbaum and Alan S. Murray
“Grand Pursuit, the Story of Economic Genius”, Sylvia Nasar
“The Rise and Fall of the Great Powers”, Paul Kennedy
“Capitalism in America, A History”, Alan Greenspan & Adrian Woolridge
“Diversity Explosion, How New Racial Demographics are Remaking America”, William H. Frey
“Clashing Over Commerce, A History of US Trade Policy”, Douglas A. Irwin
“Destined for War, Can America and China Escape Thucydides’s Trap”, Graham Allison
“A Great Leap Forward, 1930s Depression and US Economic Growth”, Alexander J. Field
“The Constitution of Liberty”, F.A. Hayek
“Judgement in Moscow, Soviet Crimes and Western Complicity”, Vladimir Bukovsky
“1931, Debt, Crisis and the Rise of Hitler”, Tobias Straumann
My next book: “Nudge”, Richard H. Thaler & Cass R. Sunstein
This institutional communication has been prepared by Ironsides Macroeconomics LLC (“Ironsides Macroeconomics”) for your informational purposes only. This material is for illustration and discussion purposes only and are not intended to be, nor should they be construed as financial, legal, tax or investment advice and do not constitute an opinion or recommendation by Ironsides Macroeconomics. You should consult appropriate advisors concerning such matters. This material presents information through the date indicated, is only a guide to the author’s current expectations and is subject to revision by the author, though the author is under no obligation to do so. This material may contain commentary on: broad-based indices; economic, political, or market conditions; particular types of securities; and/or technical analysis concerning the demand and supply for a sector, index or industry based on trading volume and price. The views expressed herein are solely those of the author. This material should not be construed as a recommendation, or advice or an offer or solicitation with respect to the purchase or sale of any investment. The information in this report is not intended to provide a basis on which you could make an investment decision on any particular security or its issuer. This material is for sophisticated investors only. This document is intended for the recipient only and is not for distribution to anyone else or to the general public.
Certain information has been provided by and/or is based on third party sources and, although such information is believed to be reliable, no representation is made is made with respect to the accuracy, completeness or timeliness of such information. This information may be subject to change without notice. Ironsides Macroeconomics undertakes no obligation to maintain or update this material based on subsequent information and events or to provide you with any additional or supplemental information or any update to or correction of the information contained herein. Ironsides Macroeconomics, its officers, employees, affiliates and partners shall not be liable to any person in any way whatsoever for any losses, costs, or claims for your reliance on this material. Nothing herein is, or shall be relied on as, a promise or representation as to future performance. PAST PERFORMANCE IS NOT INDICATIVE OF FUTURE RESULTS.
Opinions expressed in this material may differ or be contrary to opinions expressed, or actions taken, by Ironsides Macroeconomics or its affiliates, or their respective officers, directors, or employees. In addition, any opinions and assumptions expressed herein are made as of the date of this communication and are subject to change and/or withdrawal without notice. Ironsides Macroeconomics or its affiliates may have positions in financial instruments mentioned, may have acquired such positions at prices no longer available, and may have interests different from or adverse to your interests or inconsistent with the advice herein. Ironsides Macroeconomics or its affiliates may advise issuers of financial instruments mentioned. No liability is accepted by Ironsides Macroeconomics, its officers, employees, affiliates or partners for any losses that may arise from any use of the information contained herein.
Any financial instruments mentioned herein are speculative in nature and may involve risk to principal and interest. Any prices or levels shown are either historical or purely indicative. This material does not take into account the particular investment objectives or financial circumstances, objectives or needs of any specific investor, and are not intended as recommendations of particular securities, investment products, or other financial products or strategies to particular clients. Securities, investment products, other financial products or strategies discussed herein may not be suitable for all investors. The recipient of this report must make its own independent decisions regarding any securities, investment products or other financial products mentioned herein.
The material should not be provided to any person in a jurisdiction where its provision or use would be contrary to local laws, rules or regulations. This material is not to be reproduced or redistributed to any other person or published in whole or in part for any purpose absent the written consent of Ironsides Macroeconomics.
© 2020 Ironsides Macroeconomics LLC.