At the end of last week’s note we discussed the bear steepening of the real rate curve without a convincing thesis on the driver, on Monday morning we think we figured it out. A Bloomberg article titled “Fed Portfolio Shift Could Hand Treasury $2 Trillion, BofA Says”. BofA’s rates strategy team discussed greater demand for bills, but didn’t say much about the impact on longer maturity real rates (high and tight like some Bob Gibson chin music), a big miss in our view. The Bloomberg article missed the second order effect as well. In our July 12 note, When the Chaos Hits the Fan, we discussed the end of QT and the debate about the optimal duration of the Fed’s balance sheet. Please see the excerpt from that note. We are calling your attention to this today because this subject may have been discussed at the July FOMC meeting, if so, it should be discussed in the minutes of that meeting scheduled for release Wednesday at 2:00 eastern.
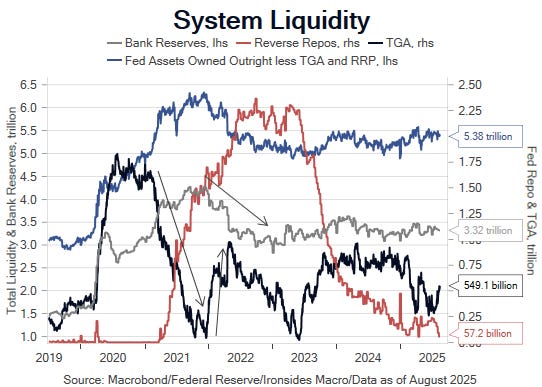
As we discussed in this week’s note the draining of the Fed’s reverse repo program (RRP) to finance Treasury rebuilding the balance in their checkbook, the Treasury General Account, has no impact on private sector liquidity. Given how low this balance currently is ($38.2 billion on Monday), if Treasury continues to raise cash to reach their $850 billion target, most of the next $300 billion (current TGA balance is $550 billion) will reduce bank reserves. The current level of reserves has been stable between $3.2 and $3.5 trillion since the end of the hiking cycle in ‘23. Most estimates of the lowest comfortable level of reserves are below $3 trillion, though that number does increase over time as bank assets grow. We bring up the liquidity dynamics because RRP falling to zero and bank reserves contracting towards $3 trillion will raise concerns, generally unwarranted, that liquidity is tightening.
We received two calls from contacts in crypto trading incredulous about the pullback being attributed to PPI. As we discussed the pullback with our contacts it became evident that the sensitivity to liquidity was the more probable catalyst for the pullback. Recall in our note the 1-year breakeven inflation rate fell 12bp last week, PPI clearly was not a big deal. We strongly suspect the 6% drop in bitcoin last week was more to do with liquidity concerns than the inflation data and impact on Fed policy. Exhibit number one was the Yellen Treasury’s $1.6 trillion liquidity injection in ‘21 when they reduced issuance and financed the $1.9 trillion ARPA primarily out of the TGA. Speculative assets soared. Exhibit number two was the Yellen Treasury’s rebuilding of TGA from $50 billion to $950 billion in ‘22. The Yellen Treasury debt management was reckless; they turbocharged monetary easing in ‘21 and tightening in ‘22. While the crypto crowd was chattering about PPI last week, it looks to us like some traders recalled the rally in bitcoin from $10,000 to $67,000 in ‘21 and plunge back to $16,000 in ‘22 during the Yellen Treasury’s Mr. Toad’s TGA Wild Ride.
In our view, increased bill issuance, TGA heading to $850 billion, RRP going to zero and bank reserves sliding to $3 trillion will not have a significant impact on private sector liquidity and any pullback in risky assets, including the poster child for risky assets (bitcoin), should be bought. However, if the Fed decides in September to reduce the duration of their portfolio, there will be a more meaningful tightening of financial conditions and potential macroeconomic effect. It is possible the Fed cuts rates, ends QT but simultaneously, or shortly thereafter, announces a duration matching balance sheet strategy. If they are not careful in the implementation, easing rate policy and tightening balance sheet policy concurrently could cause an everything rally, followed by a nasty reversal. Look for a balance sheet duration discussion in Wednesday’s FOMC minutes.
Below in the section of our July 12 note discussing Governor Waller’s speech and the implications of the Fed reducing the duration of their portfolio.
Accounting for interest rate risk: Matching Fed assets to liabilities, Dallas Fed