Employment Situation Preview
Super tight labor market, will wage growth peak anyway and what it means for the Fed

Relief Rally
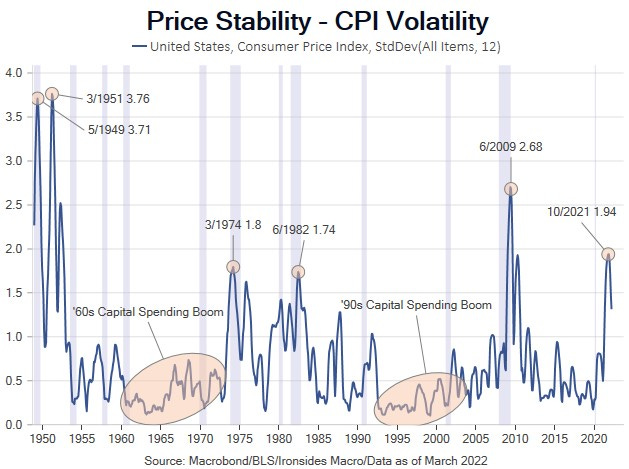
As we wrote in last Saturday’s note Relief Rally, the hurdle for the FOMC to deliver a hawkish surprise was exceptionally high. The major headlines that triggered the sharp rally in equities (3%), front-end of the Treasury curve (-15bp), yen, euro and offshore yuan was removing the option of a 75bp hike from near term policy options and the tentative start to balance sheet contraction (QT). For the start to QT, we expected something like $65 billion, $80 billion then the $95 billion cap. Instead, they will cap Treasury maturities at $30 billion for 3 months before jumping to $60 billion. For mortgages the caps are $17.5 billion for 3 months before reaching the $35 billion cap, which at current prepay speeds they will not reach. The bulk of the easing during the pandemic was QE, the cautious approach to QT is a setback in their quest to rebuild credibility. At least on the day, inflation breakevens widened and real rates fell. Said another way, it is highly unlikely the Fed will push as hard from above the 2% target as they did from below, the costs are much higher. Nor should they, we have long believed the Fed should be targeting price stability rather than a specific level and their obsession with the effective lower bound led to malinvestment. In fairness to the FOMC, goods prices have peaked, housing prices are likely to, and wages are showing evidence of peaking as we will discuss in our employment report preview below. It should be game on for cyclicals and inflation beneficiaries. We have likely reached the end of the beginning of the tightening cycle. We will write more about our inflation outlook in this week’s note following the April employment report we preview in this note.
Diminished Slack and Greater Dynamism
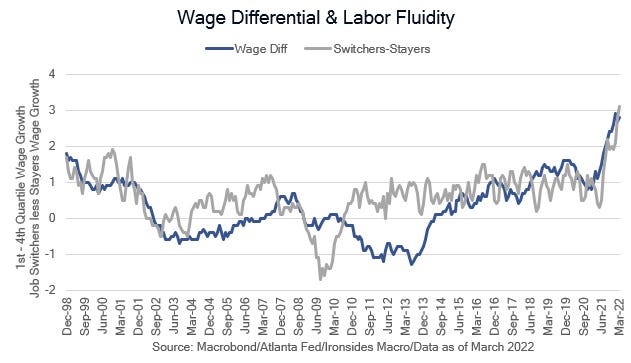
With the release of the March job openings and labor turnover survey (JOLTS) our labor slack index reached an all-time low. On a more optimistic note, however, reallocation also increased and showed signs of moving higher in the months to come with pandemic behavior receding. Let’s step back for a minute; there are two forces driving wage growth higher at present. The first is diminished slack best illustrated by the wage differential chart (wage growth for the bottom quintile less the top quintile using the Atlanta Fed Wage Tracker data). This type of wage growth is generally unsustainable as it usually signals productivity degrading over time. The second factor driving wage growth is increased fluidity. Labor market fluidity (dynamism or mobility) is less inflationary as it increases productivity over time. The easiest way to visualize fluidity is the differential between Atlanta Fed jobs switchers less job stayers. Both of these measures are at the highest levels since the Atlanta Fed began these series in the late ‘90s. Another measure of fluidity is known as worker reallocation; it is the quarterly sum of hiring and separations (layoffs and quits) expressed as a percent of total employed. This measure also reached its best level since the JOLTS data was introduced in December 2001. The ‘Great Resignation’ is a great mischaracterization: what we are witnessing is a recovery of labor market dynamism that was impaired by series of structural factors including licensing, the housing market collapse, the Chinese Labor Shock, technology boom and expansion of the social safety net following the financial crisis and pandemic.