


Echoes of ’87, and now ‘88
Echoes of ’87, and now ‘88
Our Belated Analysis of the 4Q18 Crash and 2019 Outlook

This is the inaugural note from Ironsides Macroeconomics LLC. For those that followed my work at Guggenheim, Barclays or Lehman, you may be familiar with some of the themes in this note. It is my intention to follow a similar schedule, weekly notes, quarterly outlooks, and flash updates when macro events warrant immediate attention. The product will be offered by subscription. Please enjoy today’s note and tune in to CNBC’s Squawk Box Monday from 8-9 am Eastern when I will be the guest host.
In this note…
The 4Q18 Crash was an ‘Echo of ‘87, 2019 is likely to follow the 1988 stock price recovery path
Global QT, not just Fed balance sheet contraction, played a central role in the ‘tightening of financial conditions’
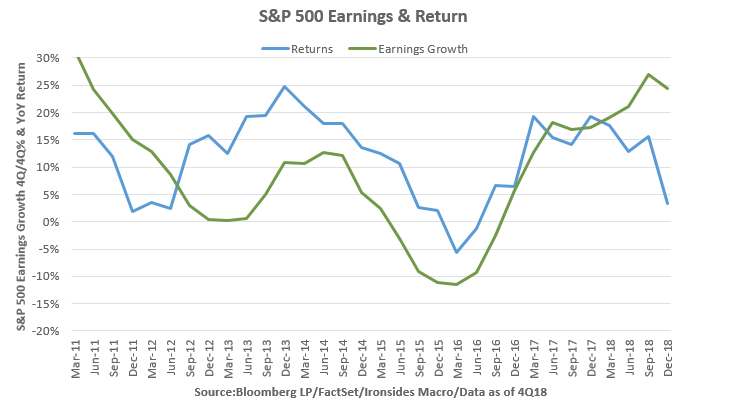
This week’s 4Q18 GDP report’s exceptionally strong capital investment, particularly intellectual property products, blew a hole in the 2019 economic deceleration thesis
Stock prices and bond yields are likely to exceed 2018 highs before the business cycle is complete, our favorite near term trade is higher longer term real rates.
In the summer of 2014, as the price of oil began a 75% decline largely as a consequence of a large multi-year increase in non-OPEC supply, my work focused on two similar non-recession related oil supply shocks; ’85-’86 and ’97-’98. In each episode the asset markets reacted quickly to the disinflationary shock, stock prices struggled amidst the negative earnings impact while Treasury yields dropped sharply. When oil prices stabilized, equity earnings reaccelerated and stock prices began major advances of 50+% that pushed valuations to historically elevated levels. The associated drop in the energy trade deficit played a role in dollar strength that led to the Plaza Accord in 1985, sparked the Asian Crisis of 1998 and the 25% increase in the trade-weighted dollar in 2014-2016.
Fast forward to January of 2017, the S&P 500 was up 55% from the February 2016 low when I wrote a report at Guggenheim Securities titled ‘Echoes of ‘87’. The ’85-’86 analog was particularly compelling given the ’86 supply-side tax cuts (lower marginal rates, fewer tax expenditures) and associated negative impact on residential investment. Alan Greenspan had just become Fed Chairman and was tightening policy despite limited evidence of inflation pressures. The Reagan Administration was waging a trade war with Japan who had a large bilateral surplus and a closed capital account. We concluded that tax reform adjustments to economic activity, monetary and trade policy, would create macro instability and the equity market was vulnerable to a crash. While the crash vulnerability call was prescient, the primary conclusion of our note was that the Crash of ’87 did not portend a recession. There were not significant economic imbalances in ’87, oil prices did not retrace the supply shock decline; household, financial and non-financial corporate debt was well below threshold levels relative to GDP that impair growth (~90%). The Crash of ‘87 did not mark the end of the business cycle and stock prices made new highs prior to the end of the business cycle.
Turns out, we actually got two crashes in 2018; the February-March 2018 plunge followed a January spike in long-term Treasury real rates and implied volatility. Fed balance sheet contraction began the process of transferring the largest source of interest rate implied volatility – mortgage prepayment risk - back to the private sector thereby contributing to fixed income implied volatility spike from an all-time low. The increase in Treasury volatility quickly reverberated through other markets leading to an implosion of short equity-index volatility products that was reminiscent of the portfolio insurance failure that played a critical role in the Crash of ’87. The trade war began at the end of stock market decline; the first crash was primarily a monetary policy normalization related correction like the 2010 end of QE1, the 2011 end of QE2, 2013 Taper Tantrum, 2014 end of QE3, and 2016 liftoff from zero rate policy.
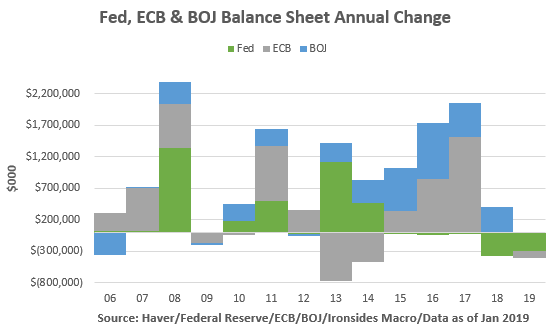
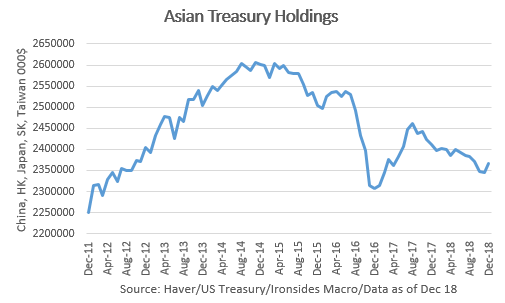
A spike in September 2018 of longer-term real Treasury rates also prompted the second crash. Fed balance contraction reached its maximum monthly caps on October 1 and agency MBS reinvestment ended. ECB large-scale asset purchases dropped from 30 to 15 billion Euros per month on the same date. A provision in the Tax Cuts & Jobs Act that allowed expensing pension contributions to pension plans at the 35% tax rate that had boosted demand for long term zero coupon Treasuries expired on September 15. Treasury issuance surged as the bill from the March 2018 Administration & Congressional spending deal came due. Finally, Asian Treasury demand for US fixed income slipped because of weakening exports. Unlike the February ‘mini-crash’, trade policy uncertainty was evident in global export growth and later earnings forecasts.

There was a recent precedent for a large liquidity supply shock; in 2015, the US fixed income market lost $1 trillion of demand when QE3 ended, the drop in oil prices reduced Petrodollar recycling by $600 billion and China had outflow pressures that resulted in ~$400 billion in Treasury sales. The 2018 loss of demand for US fixed income was quite similar in size ($2 trillion), though, despite the narrative that Fed balance sheet contraction was the primary issue, in fact ECB tapering and reduced BOJ QE had a larger effect. Both episodes left Treasury yields little changed, however, every other fixed income product spread widened sharply and equities struggled as well.
Now that we have made our case that, the 4Q18 equity market slump was an ‘Echo of ‘87’ with unintended consequences of unconventional monetary policy playing a pivotal role, for the rest of the note we will offer our belated 2019 outlook.
TCJA was a Corporate Supply Side Economics Success

We have long expected a capital-spending boom to develop in the US. In my view, a necessary condition for a strong period of capital investment is low inflation volatility near levels that persisted during the ‘60s and ‘90s when non-residential fixed investment exceeded 9% average annualized growth. Both of those business cycles also included supply-side corporate tax reform similar to the Tax Cuts & Jobs Act (TCJA): the Tax Reduction Act of 1964 and the Tax Reform Act of 1986. More secularly, the 20-year period of rapid globalization due largely to a 120% increase in the supply of industrialized labor is complete¹. We have long been proponents of the U.S. manufacturing renaissance thesis; in short rising labor, transportation and energy costs as well as increased supply chain and exchange rate risk have eroded the cost advantage of manufacturing in the developing world. Specific to recent developments, notwithstanding a probable rebound in Asian exports in 2Q19, the weakening trend is secular as evidenced by 14% annualized growth in Chinese, Japanese, South Korean and Taiwanese exports during the ‘00s expansion and only 6.5% growth in the ‘10s cycle. We expect the business of manufacturing where final demand resides to proliferate.
¹ Demographics Will Reverse Three Multi-Decade Global Trends, Charles Goodhart and Manoj Pradhan https://www.bis.org/publ/work656.htm
Back to our ’87 analog briefly; the ’86 Tax Reform Act slowed residential investment while capital investment boomed for the balance of the business cycle, and after a shallow recession in ’91, through the ‘90s expansion. Our table clearly shows similar effects, the capping of state and local property taxes and a Fed tightening cycle were the likely culprits for slower residential investment in 2018. In 1987, the reduction in individual tax rates against a 10% mortgage rate was a significant increase in the after-tax cost of mortgage finance. Although both tax reform laws cut individual tax rates and expenditures, the more profound effects were on the corporate sector.

An underappreciated aspect of the corporate tax code, even by the Administration and most of their private sector supply-side economics proponents, is that the effective tax rate for equipment investment was already the second lowest in the G20². The low effective rate was due to 50% bonus depreciation at a 35% rate on assets that generally depreciated over 3-5 years. The effective rate on structures investment, physical plant, was the second highest in the G20 due to ~30-year depreciation and a prohibitive 35% tax rate. No doubt, the effect tax rate did not help stem the outsourcing of manufacturing trend. Finally, the real boom in 2018 occurred in the intellectual property (IPP) category – software and R&D. The Bureau of Economic Analysis considered IPP an expense until 2013 and they do not capture it in the monthly core capital goods report that most investors and economists utilize as their primary indicator for capital investment. The effect of immediate expensing on rapidly depreciating assets like software and stronger cash flow on long lead-time investments like R&D help explain a doubling of the growth of IPP and tripling of R&D investment in 2018 relative to the prior ten year trend. A positive externality is the surge in commercial and industrial lending to finance investment, bank sector profitability metrics improved decidedly in 4Q18 results. In other words lending to corporates is considerably more profitable than buying government securities.
² International Comparisons of Corporate Income Tax Rates, CBO March 2017 https://www.cbo.gov/system/files/115th-congress-2017-2018/reports/52419-internationaltaxratecomp.pdf

So, why did we go through our case for capital investment in painstaking detail? Unlike consumption, investment in capital and labor are positive implications for future growth and inflation. This leads us to the increase in productivity and our favorable outlook for 2019. The improvement in labor productivity is most likely attributable to our favorite labor market indicator: worker reallocation. Consider that there are 128 million private sector employees in the U.S., in December 2018, 5.56 million got a new job and 5.55 million separated from their prior job, 2/3’s voluntarily. This sums to 25.2% turnover every quarter, a figure that was as high as 28.6% just after the Job Openings and Labor Turnover Survey (JOLTS) began in December 2000, to a low of 20.1%in February 2010 during the aftermath of the Global Financial Crisis. Increased turnover means higher sustainable wage growth due to associated gains in productivity and the surge in 2018 implies further wage and productivity gains in 2019.
We would be remiss if we did not add a couple of thoughts about consumption. Inasmuch as one believes the Commerce Department’s guesstimate for December retail sales and BEA’s personal spending data accurately portray a deceleration in consumption, we would note that 4Q87 PCE slowed sharply from 4.6% q/q annualized in 3Q87 to 0.9% only to increase 7.3% in 1Q88. Additionally it was our expectation, and the data supports this, that because consumption ‘normalized from the 2% post-crisis trend from 2H09 to 1H14 to 3%, TCJA’s individual tax rate wealth redistribution would not boost spending for more than a couple of quarters. To be clear, household balance sheets and labor market fundamentals are strong; therefore, consumption is likely to remain in the 2 ¾% range. More broadly the oft-cited consumption is ~70% of GDP is misleading on a number of levels. First, 70% includes healthcare which has been rising as a percent of GDP since the mid-‘60s. Next the expenditure method of estimating aggregate economic output (GDP) has the lowest correlation to corporate revenues and earnings of the three the government releases. Gross domestic income is better and gross output, which includes intermediate, or business-to-business transactions relates even more closely to corporate activity. Unfortunately, both of these lag the release of GDP. One final point, we believe the information content in corporate data is more robust than government macroeconomic data. We prefer what we refer to as ‘micro to macro’, that is using corporate data to estimate macro trends.

Consumer inflation is not responding to slack
The mix of growth matters. Had TCJA boosted consumption the inflationary impulse of accelerated growth would likely have been greater than was the case. Instead, investment in productivity enhancing technology products suppressed core services prices, global excess capacity and weakening global trade put downward pressure on core goods prices, US unconventional energy supply – more technology investment – capped oil prices and improved labor market dynamism boosted wages and labor productivity. These dynamics provided the cover for the FOMC to deliver on their original mandate; stabilize financial conditions, in the case by halting policy normalization. One quick note, we do not believe it is necessary to halt balance sheet contraction. However, we would never have put balance sheet on autopilot, particularly given that the ECB ended asset purchases in 2018 and the BOJ reduced their asset purchases as well. Belief in the Phillips Curve in the Eccles Building (Fed Board) runs deep, we expect there will come a point in 2H19 when the FOMC will restart the rate hikes only to stop again in early 2020 as election year public policy uncertainty slows business investment. We penciled in one hike in October in the latest CNBC survey.
What are we supposed to do with this?
We spent the last three months arguing, mostly on financial television, that the 20% drop in the S&P 500 in 4Q18, although it was equivalent to the median decline associated with a post-WWII recession, was a false negative. We first wrote ‘Echoes of ‘87’ on January 27, 2018 and stuck to that narrative through the meltdown and recovery. We expect the S&P 500 will continue to follow the ’88 path and make a new high before the business cycle is complete, most likely in 2019. We do not believe that the long-term Treasuries yields will make a new high this cycle above the 2010 4% peak, but, do expect a new high above the 3.25% 2018 peak. In the near term, we have greater conviction in higher Treasury yields than stock prices. It is not lost on us that the divergence between the +11% year to date advance in the S&P 500 and three basis points increase 10-year Treasury yields. In our view, the Treasury market is reflecting Conundrum related factors – central bank conventional and unconventional policies – not the economic outlook. Still, as the data fog associated with the U.S. government shutdown and Chinese New Year clears, we expect the global growth outlook to stabilize and U.S. outlook to improve. Additionally demand for capital will remain robust, improved wage growth will test the Fed’s patience, not enough to change policy until 4Q19; instead, we expect marginally more hawkish commentary from FOMC participants. Let us be clear, the delayed 4Q18 GDP report, in particular the non-residential fixed investment and especially intellectual property products, blows a giant hole in the argument that 3.1% 2018 GDP was due to Keynesian demand stimulus that would quickly reverse in 2019. The supply-side effects were significant, growth is likely to be better than expected and the business cycle is not in any jeopardy. Stocks prices and bond yields are very likely to exceed 2018 peaks in 2019. Next week we will dig deeper on sectors and asset classes, this week we wanted to catch our readers up on how we viewed the tumultuous events since we left Guggenheim and what those views implied for the 2019 outlook. Once again, it really was not very different this time.
Barry C. Knapp
Managing Partner
Ironsides Macroeconomics LLC
908-821-7584
https://www.linkedin.com/in/barry-c-knapp/
@barryknapp
SEE IMPORTANT DISCLOSURES
This institutional communication has been prepared by Ironsides Macroeconomics LLC (“Ironsides Macroeconomics”) for your informational purposes only. This material is for illustration and discussion purposes only and are not intended to be, nor should they be construed as financial, legal, tax or investment advice and do not constitute an opinion or recommendation by Ironsides Macroeconomics. You should consult appropriate advisors concerning such matters. This material presents information through the date indicated, is only a guide to the author’s current expectations and is subject to revision by the author, though the author is under no obligation to do so. This material may contain commentary on: broad-based indices; economic, political, or market conditions; particular types of securities; and/or technical analysis concerning the demand and supply for a sector, index or industry based on trading volume and price. The views expressed herein are solely those of the author. This material should not be construed as a recommendation, or advice or an offer or solicitation with respect to the purchase or sale of any investment. The information in this report is not intended to provide a basis on which you could make an investment decision on any particular security or its issuer. This material is for sophisticated investors only. This document is intended for the recipient only and is not for distribution to anyone else or to the general public.
Certain information has been provided by and/or is based on third party sources and, although such information is believed to be reliable, no representation is made is made with respect to the accuracy, completeness or timeliness of such information. This information may be subject to change without notice. Ironsides Macroeconomics undertakes no obligation to maintain or update this material based on subsequent information and events or to provide you with any additional or supplemental information or any update to or correction of the information contained herein. Ironsides Macroeconomics, its officers, employees, affiliates and partners shall not be liable to any person in any way whatsoever for any losses, costs, or claims for your reliance on this material. Nothing herein is, or shall be relied on as, a promise or representation as to future performance. PAST PERFORMANCE IS NOT INDICATIVE OF FUTURE RESULTS.
Opinions expressed in this material may differ or be contrary to opinions expressed, or actions taken, by Ironsides Macroeconomics or its affiliates, or their respective officers, directors, or employees. In addition, any opinions and assumptions expressed herein are made as of the date of this communication and are subject to change and/or withdrawal without notice. Ironsides Macroeconomics or its affiliates may have positions in financial instruments mentioned, may have acquired such positions at prices no longer available, and may have interests different from or adverse to your interests or inconsistent with the advice herein. Ironsides Macroeconomics or its affiliates may advise issuers of financial instruments mentioned. No liability is accepted by Ironsides Macroeconomics, its officers, employees, affiliates or partners for any losses that may arise from any use of the information contained herein.
Any financial instruments mentioned herein are speculative in nature and may involve risk to principal and interest. Any prices or levels shown are either historical or purely indicative. This material does not take into account the particular investment objectives or financial circumstances, objectives or needs of any specific investor, and are not intended as recommendations of particular securities, investment products, or other financial products or strategies to particular clients. Securities, investment products, other financial products or strategies discussed herein may not be suitable for all investors. The recipient of this report must make its own independent decisions regarding any securities, investment products or other financial products mentioned herein.
The material should not be provided to any person in a jurisdiction where its provision or use would be contrary to local laws, rules or regulations. This material is not to be reproduced or redistributed to any other person or published in whole or in part for any purpose absent the written consent of Ironsides Macroeconomics.
© 2019 Ironsides Macroeconomics LLC.