Charts that Couldn't Wait
House prices plunge, jobs a lot less plentiful


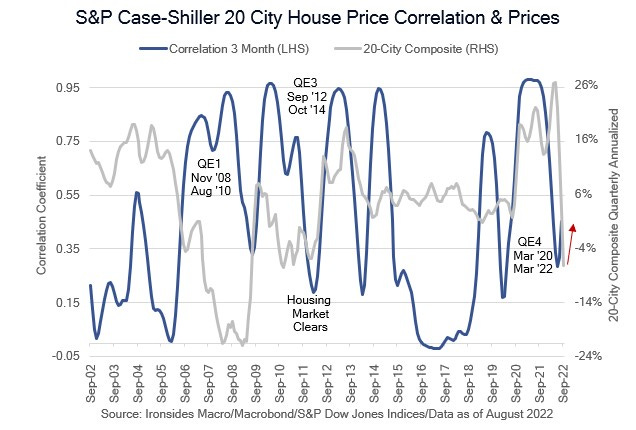
House Prices & Jobs Less Plentiful
This morning’s August Case Shiller 20-City Composite fell 1.32%, far weaker than consensus expectations for -0.80% and July was revised from -0.44% to -0.69%. The 3-month annualized rate was -7.27% from 3.07% in July and 26.39% in April. The 3-month average of correlation of the 20 individual cities was an incredible .97 from January through September 2021 while the Fed built their holdings of agency mortgage-backed securities to 30% of the market causing mortgage rates and spreads to swaps and Treasuries to fall to their lowest levels ever. By June, only 3 months after the tightening process began, correlation plunged to .28. Correlation is now beginning to increase as it did in 2009-2010 when prices were plunging together. A look through each of the 20 cities confirms that prices are heading lower in all of them. What is most noticeable from our first chart is the slope of the decline in the 20-City Composite is much steeper than from the mid-2006 peak. Can the Fed really wait for plunging house prices to flow through to shelter measures in CPI and PCED? The housing market is breaking.