


Central Banks, Banks & Currencies
Central Banks, Banks & Currencies
The End of the Global Growth Slowdown Narrative

Thank for your interest in our work, we were pleased with the response to our first two notes. We hope you will consider becoming a paid subscriber.
Unconventional monetary policy and the credit channel, banks investors hate QE, NIRP, ZIRP and most of central bankers favorite things
The currency channel of monetary policy is less efficacious than the ECB and BOJ believe
The ECB forecast cuts, Friday’s US employment report and Asian export data likely marked the beginning of the end of the slowing global growth narrative
A year ago around this time, the markets were beginning to discount the end of consensus outlook for global synchronized growth. This week’s soft headline February employment number, weak Chinese and Taiwanese February trade data and German January manufacturing orders were consistent with the slowing global growth narrative. In the second part of this note, we will make our case for a developing positive inflection in that market implied growth outlook. Before we turn to the data, we are going to discuss an insidious (bank credit) and an inefficacious monetary policy channel (currency).
Thursday morning’s ECB meeting was a stark reminder of the ‘global dimensions of unconventional monetary policy.’ We chose to characterize the global drop in rates, equity prices and financial stocks using the title of the 2013 Kansas City Fed Jackson Hole Economic Symposium as reminder of the event that marked what a former senior Fed official described as ‘the point when academic support for QE ended.’ We have written extensively about the second and third order deleterious effects of unconventional policy, beginning with our work in 2011 at Barclays on the post-WWII period of explicit government security yield caps and extraordinarily tight financial sector regulatory policy.
Our most important conclusions from this work for investors are the following: unconventional monetary policy impairs creative destruction thereby fostering zombie companies who act as a drag on productivity and dynamism. The best market based evidence of a lack of macroeconomic efficacy was the widening of the equity risk premium of economically sensitive cyclical stocks during the non-crisis QE era from the launch of QE2 in autumn 2010 through the Taper Tantrum in 2013. An obvious observation to anyone watching the markets Thursday morning is the negative impact of unconventional monetary policy on bank profitability. A somewhat counter-intuitive and perhaps controversial conclusion of our work is that central banks have less ability to influence exchange rates that most investors believe.
Bank Shareholder Antipathy Towards Central Banks
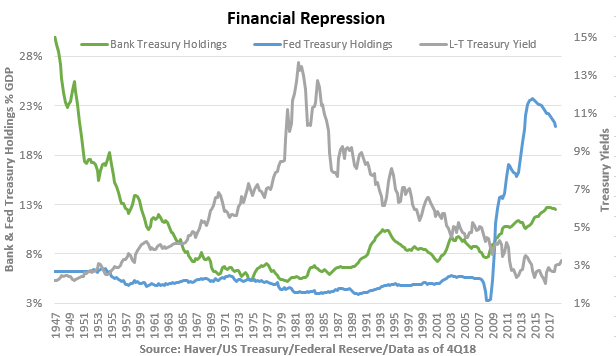
The World War II explicit interest rate caps - 3/8% for Treasury Bills and 2 1/2% for long term securities - that remained in place until the Fed/Treasury Accord of 1951 plus a two year ‘taper’, led to the banks and Federal Reserve holding over 30% of the outstanding stock of ‘riskless’ government securities. The post-Global Financial Crisis QE drove bank and Fed holdings to similar levels. Because the ‘40s government debt monetization was implemented using explicit caps, the bulk of the securities resided on the bank’s, rather than the Fed’s, balance sheet, thereby crowding out private sector lending. We strongly suspect that the tepid growth and series of recessions in the late ‘40s and ‘50s was partially attributable to the impaired credit creation channel. Additionally, the exceptionally tight regulatory regime – virtually zero bank failures during the ‘50s - capped commercial bank return on equity below 10%. Not surprisingly, banks equities performed poorly through the ‘50s.
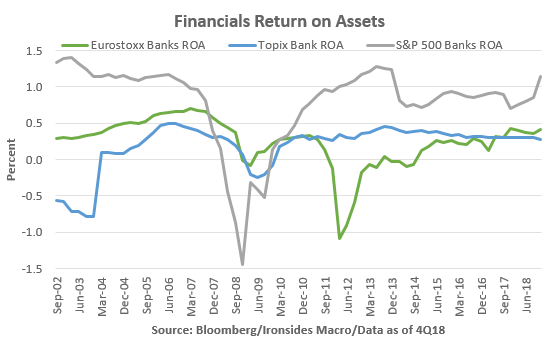
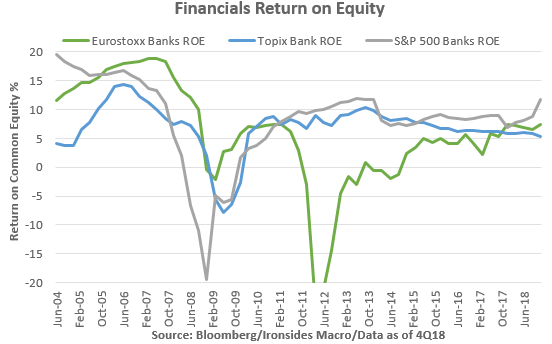
Similarities between the current monetary and regulatory regimes and the ‘50s analog were the primary reason why we were underweight bank equities from the crisis until the release of the June 2017 US Treasury Reform proposal. We expected that the combination of Fed balance sheet contraction and looser regulatory policy would start a mix shift in bank assets from government securities to private sector loans. We were not disappointed in 2018 culminating in 4Q18 results showing a sharp jump in the return on assets (ROA) of 1.14% for the S&P 500 Banks Index, well above the Eurostoxx Bank Index ROA of 42bp or Topix Banks’ at 27bp. The return on equity (ROE) is 11.77% for the US, 7.5% for Europe and 5.3% for Japan. Generally, ROE’s below 10% imply bank equities should trade below book value, as they are not earning their cost of capital.
We recommend underweighting European and Japanese bank stocks given that we see no evidence that the European Central Bank views the costs of their monetary or regulatory policy on the bank credit channel as outweighing their inflation target mandates. While the BOJ began acknowledging the deleterious impact on the banking system of unconventional monetary policy well before the ECB, however, like the Phillips Curve in the US, the ECB and BOJ’s belief that inflation is always a monetary phenomenon runs deep implying they unlikely to change course without evidence of inflationary pressures. Additionally we have no reason to believe European bank regulators are close to easing back on the post-crisis policies.
For now we are sticking with our overweight for US financials with a preference for regional and small cap banks, though we are mindful that regulatory policy concerns will intensify as the 2020 Presidential election comes into focus. Keep in mind the first Democratic debates begin this summer. Also of note, the disinvestment from government securities for the largest 25 banks by assets, stalled in recent months. The reversal began in early November; initially it may have been attributable to risk aversion as the stock market came under pressure. Given the stabilization of the markets in 2019, we suspect the Fed pause is driving the increase in securities holdings. We aren’t yet overly concerned because the increase in securities does not appear to be at the expense of loan growth. The same pattern has not developed in smaller banks where private sector lending continues to grow more rapidly than the large banks.
Central Bank Mercantilism
This brings us to what we believe to be a primary motivation behind ECB and BOJ policy, the currency channel and attempts to weaken their currency to support mercantilism economic models in Germany and Japan. We are not impugning ECB President Draghi’s motives; instead, we believe the weakening of German resistance of unconventional policy is primarily due to slowing global exports and their inability to sell capital goods to Asia. We found it notable that the weakness in the Euro following the ECB meeting proved transitory. Based in part on our assessment of the primary catalyst for the 23% increase in the trade-weighted dollar from mid-2014 to early 2016, our view is that the currency channel of monetary policy is weaker than central bankers believe. Recall that in the fall of 2014 the Fed ended QE3 while the ECB announced sovereign QE; in other words policy diverged sharply. Shortly thereafter, the BOJ went more deeply into negative rates and increased their QE programs. No doubt, officials at the ECB and BOJ were congratulating themselves over the significant weakening of the euro and yen.
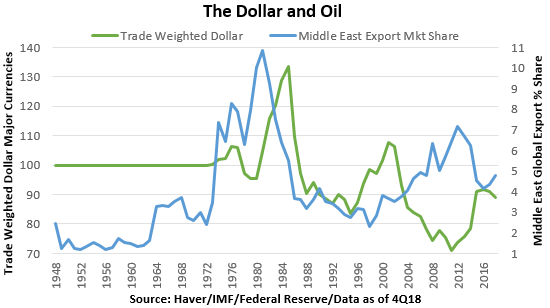
We have an alternate theory about why the dollar strengthened; the plunge in the price of oil, sharp increase in US production and associated drop in the US current account deficit. Consider the last five decades, the oil market and dollar trends. Perhaps the final straw in the end of the Bretton Woods fixed exchange rate regime in 1971 was the US current account deficit increasing from 1% to 2% largely due to the oil deficit. During the OPEC embargoes of the ‘70s, the US dollar was under pressure; additionally the closed Japanese capital account came under pressure in ’73 and ’79 as well. After Reagan deregulated much of the unproductive ‘70s energy policy production surged back to 9 million barrels per day, prices crashed and the dollar increased sharply until the Plaza Accord. Production then began a three-decade decline in the US, however, there was another surge in non-OPEC production in the ‘90s leading to a second supply shock decline and the dollar rallied again. The ‘00s saw the US energy deficit peak at $440 billion in 2008 and like the ‘70s, the dollar was generally weak during the ‘00s expansion. In short the ‘70s and ‘00s were peak oil weak dollar decades, the ‘80s, ‘90s and ‘10s had weak oil prices due to supply shocks and the dollar was generally strong. Finally, we ran Grainger causality analysis on those episodes and there was significant statistical support for our thesis.
One additional note, in 2017 the ECB was buying $1.5 trillion and the BOJ $500 billion of bonds, while the Fed was hiking rates and beginning balance sheet contraction, yet the dollar weakened throughout the year. So much for central bank divergences influencing exchange rates. We are reasonably bearish on the dollar at present, largely because we have long believed that a currency agreement to strengthen the yuan would be integral to the US/China trade deal like the ’71 or ’85 US/Japan deals. The ‘85 Plaza Accord looms large over the greenback.
Turning Point for Slowing Global Growth
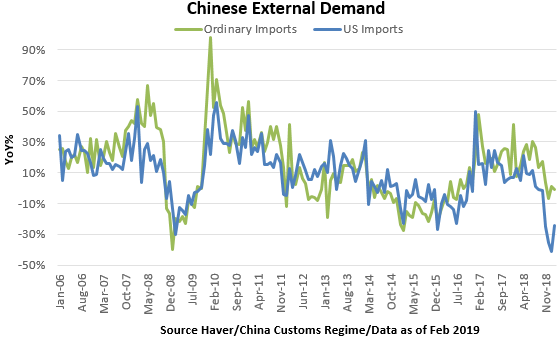
Friday morning may well prove to be the final hurrah of the slowing global growth view; sure Chinese and Taiwanese export growth was weak, however, Chinese ordinary import growth at -1.2% year-on-year compares quite favorably to the February 2015 low of -23.2% during the heavy industry hard landing. This is our proxy for China’s external impulse; in our view, the heavy industry investment collapse of 2014-16 was a much larger external shock than the pressure on their export sector. It also appears that the ‘boycott’ of US products may be ending. The uptick in the February Caixin PMI implies that domestic demand may be improving as well. If we are correct, the ECB’s forecast cuts may prove too pessimistic, German manufacturing data tends to lag Asia by at least one quarter.
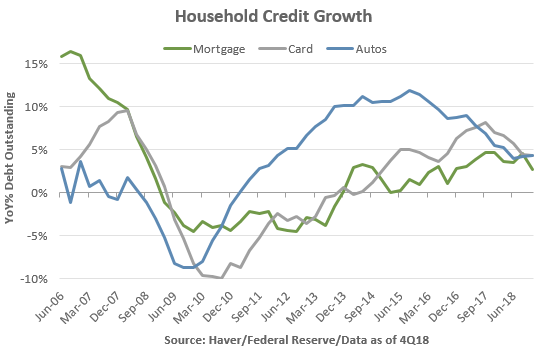
We also strongly suspect that US market implied growth outlook is likely to move higher in the coming weeks. The February headline employment miss is of little consequence in our view; as we wrote in our labor market preview note this week, (https://ironsidesmacro.substack.com/p/february-employment-report-preview) the size of the headline jobs number relative to the labor market makes the number statistical noise. Additionally, weakness in leisure & hospitality and construction sectors was likely attributable to a snowstorm in the establishment survey week, making it likely that weather explains much of the shortfall. We did get the sharp drop in the U6 underemployment rate we expected and an extension of the uptrend in wage growth. The broadest measure in the report, the aggregate hours index, is running at a 2.2% 3-month annualized rate. Total hours worked plus trend productivity growth is probably a better GDP proxy at present than GDP tracking estimates. 1Q19 GDP tracking estimates have no retail sales, trade or inventory data and last week’s 4Q18 GDP report made it abundantly clear that using the core capital goods orders to proxy capital spending is a mistake given strength in intellectual property products. Earnings reports from retailers point to consumption remaining close to the 2 3/4% 4Q18 trend, Thursday’s 4Q18 Treasury Flow of Funds report showed further drops in household leverage thereby reducing the probability of slower consumption. The confidence shock associated with the 4Q18 stock market slump has passed, when the data fogs clears we believe the trend nominal and corporate revenue growth will continue to be ~5%.
We still like bear steepeners in the rates space despite the retracement this week in nominal 10-Year Treasury yields, 2s10s2 year forward, 5s30s and 2s10s real rates (TIPS) are all steepening. In the US equity market we expect the recent underperformance of small caps and cyclicals to reverse in short order.

Barry C. Knapp
Managing Partner
Ironsides Macroeconomics LLC
908-821-7584
https://www.linkedin.com/in/barry-c-knapp/
@barryknapp
SEE IMPORTANT DISCLOSURES
This institutional communication has been prepared by Ironsides Macroeconomics LLC (“Ironsides Macroeconomics”) for your informational purposes only. This material is for illustration and discussion purposes only and are not intended to be, nor should they be construed as financial, legal, tax or investment advice and do not constitute an opinion or recommendation by Ironsides Macroeconomics. You should consult appropriate advisors concerning such matters. This material presents information through the date indicated, is only a guide to the author’s current expectations and is subject to revision by the author, though the author is under no obligation to do so. This material may contain commentary on: broad-based indices; economic, political, or market conditions; particular types of securities; and/or technical analysis concerning the demand and supply for a sector, index or industry based on trading volume and price. The views expressed herein are solely those of the author. This material should not be construed as a recommendation, or advice or an offer or solicitation with respect to the purchase or sale of any investment. The information in this report is not intended to provide a basis on which you could make an investment decision on any particular security or its issuer. This material is for sophisticated investors only. This document is intended for the recipient only and is not for distribution to anyone else or to the general public.
Certain information has been provided by and/or is based on third party sources and, although such information is believed to be reliable, no representation is made is made with respect to the accuracy, completeness or timeliness of such information. This information may be subject to change without notice. Ironsides Macroeconomics undertakes no obligation to maintain or update this material based on subsequent information and events or to provide you with any additional or supplemental information or any update to or correction of the information contained herein. Ironsides Macroeconomics, its officers, employees, affiliates and partners shall not be liable to any person in any way whatsoever for any losses, costs, or claims for your reliance on this material. Nothing herein is, or shall be relied on as, a promise or representation as to future performance. PAST PERFORMANCE IS NOT INDICATIVE OF FUTURE RESULTS.