

Abundant Liquidity, For Now
Debt ceiling risk, moving the disinflationary goal posts, construction employment, retail sales distortions

Abundant Liquidity, for Now
The inflation news this week was quite favorable: core services less rent of shelter, Chairman Powell’s key metric, increased 0.26% from February and on a 6-month basis was 3%, down sharply from September’s 9.5% peak. If we remove the lag impaired rent of shelter index from all items CPI, the annualized rate is 2.3%. PPI, while import prices, Chinese manufacturing PPI and imports are pointing to a second goods price disinflationary impulse in coming months. Despite the easing of inflation in the model Chairman Powell delineated in late November, several FOMC participants appear intent on an additional rate hike. The interest rates market message is pretty clear, as 2-year breakeven inflation fell 25bp this week but the real rate component increased 25bp (tighter financial conditions) and both the near-term forward spread and the 3m10y yield curve are 150bp inverted. In other words, the markets believe the Fed staff forecast that the FOMC is increasingly likely to cause a recession.
The primary factor in our favorable 1H23 outlook for stocks and bonds was disinflation that we characterized as the path from 9 to 4, and a secondary factor was abundant liquidity. On balance, disinflation is exceeding our expectations, with CPI likely to be closer to 3% than 4% by June. But while liquidity is abundant for the aggregate system, monetary and regulatory policy intended to make the system safer for households accelerated government competition for short-term financing with the private sector generally, and banking system specifically, exposed financial system vulnerabilities outside the systemically important banks. Friday’s strong 1Q23 earnings reports from four large banks, rather than alleviating concerns, highlighted banking balkanization. Surging net interest income and the changing asset mix from the largest banks led to sharp increases in profitability (return on equity and assets). Regulatory constraints on large banks (supplementary leverage ratio, high quality liquid assets, risk-based capital requirements, etc.) and Wells Fargo’s asset cap acted as a constraint on deposit growth and insulated the banks most capable of managing duration risks from the counterproductive ‘21 liquidity injections from Fed asset purchases and the Treasury Department’s reduced issuance (draining the TGA).
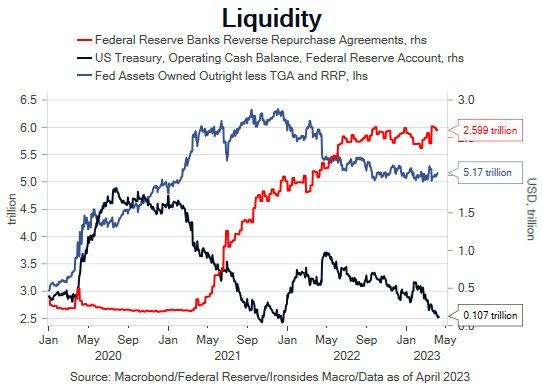
If we think of aggregate system liquidity as Fed assets owned outright (permanent injections) less Fed repo programs and the Treasury General Account (TGA), liquidity has been stable since the end of September as the reduction in the TGA balance offset Fed balance sheet contraction (QT). We won’t bother with calculating returns on a range of risky asset classes, and do not intend to infer that the stabilization in liquidity is the sole driver, however the mid-October low was the end of the Fed policy normalization related equity market correction, and the S&P is +24% from the low. We went down this path because the debt ceiling debate is about to intensify. Speaker McCarthy is set to give a speech in NYC on Monday, and his asks are unspent pandemic stimulus, work requirements and cuts in discretionary spending. The Administration has shown no inclination to negotiate. Most economists, strategists and market participants will focus on the probability of a risk-off event that we think is likely to be ~4% based on the late 95/96 Clinton/Gingrich and 2013 Obama/Boehner government shutdown episodes. We think conditions in 2011 were decidedly different, consequently a minor episode will force a deal. We are more concerned about the implications for liquidity when Treasury increases issuance to rebuild the balance in the TGA. We still have a window where disinflation and abundant liquidity is providing support for asset prices despite misguided monetary policy, slowing growth and contracting bank credit. Around 4100 for the S&P 500 and 3.50% for 10-year USTs we are not excited about committing additional capital to either of the major asset classes ahead of a Fed meeting where they seem likely to hike another 25, even if they pledge a pause. A pullback in the S&P 500 might tempt us given the disinflationary progress. Our colleagues at Macro Risk Advisors note that since the Silicon Valley Bank collapse, 1-month 95% S&P 500 put implied volatility is unchanged, however the 105% call is 3% lower at 12.5%. Buying that call looks like a decent way to position for an FOMC epiphany that it’s time for a pause.