

2H20 Outlook: The Next Cycle
The '20s expansion, margin expansion, political headwinds, export recovery and risk reduction time

This is the last note from the New Jersey office of Ironsides Macroeconomics, from this point our home base will be Vail, Colorado. Once everyone begins to return to offices and we can resume in person visits we will include our travel schedule in our notes.
We are making this note available to all subscribers, if you are not a subscriber we would like you to consider becoming one to gain access to the full notes, chart books and the director of research. Details can be found by clicking on the button below.
The ‘20s Expansion
For investors, the recession ended on March 23, after a greater than average recession-related drop in the S&P 500 and what is likely to be greater than average earnings decline. Through the end of June, sector performance followed the recovery roadmap, early stage cyclical sectors and small caps beat the index and defensive sectors lagged. As we kickoff 3Q20 with June economic activity and 2Q earnings reports, economists, strategists and investors will lament levels and output gaps when they should focus on the effect of creative destruction on potential growth in the ‘20s. Late in the ‘10s expansion, trend productivity increased from 1% to 1.8% likely due to technology innovation adoption in services. If we are correct about the cause of the notoriously difficult to explain, let alone forecast, improvement in productivity, the Covid-19 pandemic will accelerate technology diffusion in healthcare, industrials and consumer products in the ‘20s. Consequently, forecasts that earnings will not get back to the 2019 peak until 2022 are missing the impact of technology adoption on potential earnings as well as the flawed logic that the shortest, sharpest recession in US history will lead to an elongated recovery.
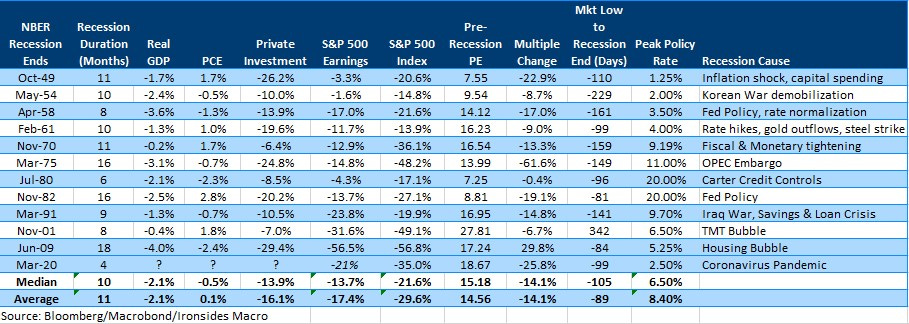
Figure 1: The S&P 500 dropped 35%, the multiple contracted 26%, and the market bottomed 99 days prior to the end of the quarter that the recession ended. This analysis of business cycles was integral to our call at the lows that the bear market was ending. We have no idea what month the NBER will declare the recession ended, but for all practical purposes it was a 2 month recession. Valuation generally looks rich in the early days of a new expansion.
DALIO SAYS FED PURCHASES ARE THE DRIVER OF THE MARKET, ECONOMY
This assertion is a fallback for investors who failed to grasp the dynamics of a business cycle, particularly one that unfolded so quickly. The recession lasted two months, Fed policy follows the cycle and during the Covid-19 pandemic primarily served to facilitate the end of the two week ‘run’ on capital markets beginning March 9 when risk parity strategies failed as both risk-mitigating Treasuries and equity prices dropped. The final stage of the decline was largely attributable to post-financial crisis policies intended to transfer risk from taxpayer-supported banks to less leveraged private sector investors. Those policies, including the Volcker Rule and risk-based capital requirements, made the system less stable during the crisis. In essence, the Fed policy response bailed out counterproductive regulatory policy. Large-scale asset purchases (QE) work primarily through volatility markets, even now equity index volatility remains elevated despite the Fed’s purchases of mortgage backed-securities and to a lesser extent Treasuries and corporate credit, are driving fixed income volatility towards record low levels. Both the monetary and fiscal policy responses were supportive, however, they were inevitable, consequently following the Fed implies missing the cycle turns when the best returns occur. For the balance of the year there is unlikely to be any significant inflection points in monetary policy. Another fiscal policy package is likely, the structure of support for state and local governments and unemployment insurance (UI) could shift growth between 2020 and 2021. More generous UI and state & local support programs will slow the recovery in private sector employment and prevent public sector employment losses, while likely lowering 2021 potential growth.
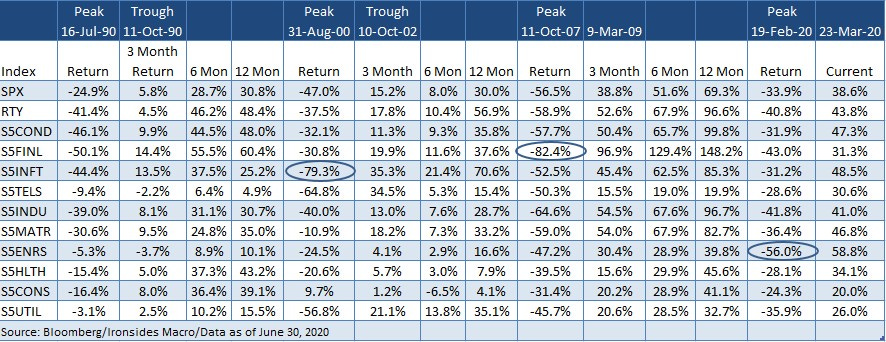
Figure 2: The only sector not following the recovery playbook is financials, we expect them to catch-up to other cyclical sectors as it becomes clear they over-reserved for loan losses and expanded their assets significantly in contrast to the last recession.
The June employment report confirmed the efficacy of our back-to-work proxy, the differential between the cumulative increase in initial jobless claims during the pandemic and continuing claims. For the second month the flows back into the labor market were immense. Unemployed to employed averaged 7.7 million the last two months from 1.3 million the prior two. Newly employed was 12.8 million from 5.1m during the contraction. We would also note that our Back-to-work proxy improved by an additional 1.2 million in the latest claims report even as the headline improvement in initial and continuing claims appears to have stalled.
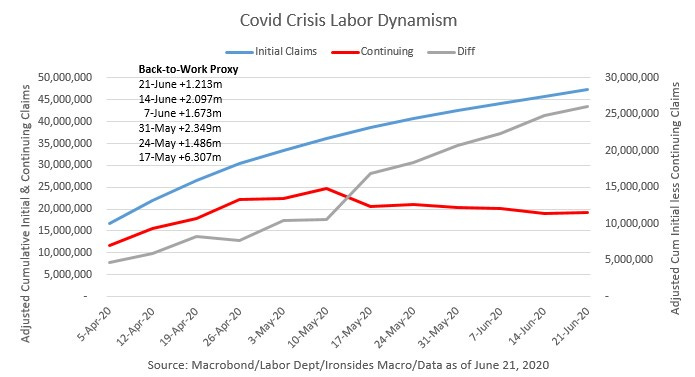
Figure 3: The spread between the cumulative increase in initial claims and cumulative claims is our proxy for back-to-work, or labor market churn. Our focus on labor market flows helped us forecast a sharper than expected recovery.
The labor market has now recovered 37% of the two-month recession job losses and 44% in the highest turnover sectors (construction, retailers and leisure & hospitality). What we found most interesting about the Bureau of Labor and ADP reports is the tepid recovery in professional & business services, administrative, finance and information industries. Additionally, average hourly earnings in these sectors has increased significantly. We suspect companies are finding out technology adoption facilitates efficiencies that renders some labor superfluous. Most economists have looked to retailing and accommodation for damage to the supply-side of the economy, we suspect efficiency due to accelerated technology adoption will not damage potential earnings, but will displace lower-skilled, less productive workers in a range of sectors. The inevitable policy response to these displaced workers will affect the trajectory of the recovery in 2021 and beyond. This was evidenced by the tepid recovery in labor market turnover from 2010 through 2013 until the end of 99 weeks of extended unemployment benefits led to a sharp increase in less skilled employment in 2014. The enhanced unemployment benefits may also be playing a role in the tepid recovery in lower skilled employment, if so the July 31 deadline is even more crucial.
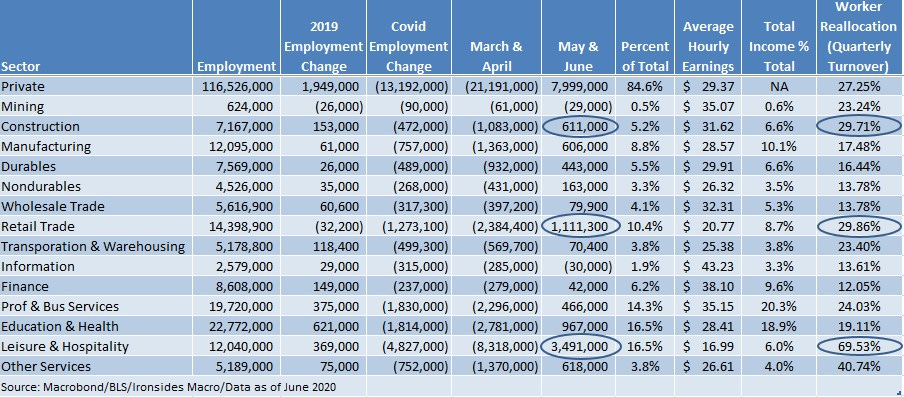
Figure 4: The circled sectors are high turnover industries during normal conditions, they were at the center of the Covid-19 pandemic storm. There has not been much of a recovery in professional & business services, finance or information. The same was true of the ADP report, we suspect lower skilled support staff in service sectors have not got re-employed. This might be attributable to the enhanced unemployment benefits and technology.
Schumpeter’s Gale: A Tailwind for Earnings
(Bloomberg) -- The stock market rally that’s erased almost all of this year’s losses can’t be justified by corporations’ profit potential, according to Goldman Sachs Group Inc. Chief Executive Officer David Solomon.
We disagree. The FOMC’s summary of economic projections imply economic growth will not reach the 4Q19 peak until 3Q22. CNBC’s Fed Survey, prior to the June meeting, asked when growth would be fully restored and the median response was 1Q22. Equity analysts are more optimistic, they expect S&P 500 quarterly earnings to reach the peak quarterly run rate in 2Q21 and 2021 is expected to exceed the 2019 peak. Most economists and their fixed income disciples will dismiss the equity estimates and equity market implied growth, as irrational exuberance. This assessment is typical of the linear thinking that traps investors in negative after-inflation yielding debt. Since the early days of the ‘20s expansion, we have argued that recessions accelerate the process of creative destruction. Said differently, necessity is the mother of invention, which in these circumstances implies technology innovation adoption in consumer facing companies, as well as industrial production, as supply chains are restructured.
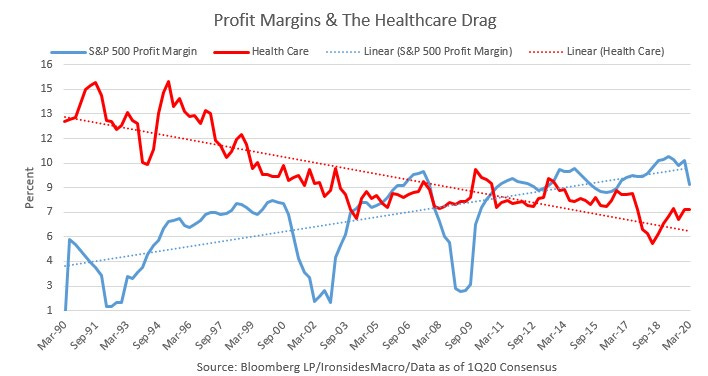
Figure 5: Healthcare margins have been falling since S&P introduced the sectors. We suspect a bottom is forming, if the sector does not improve productivity and deliver services at a lower cost it faces an existential threat from the progressive wing of the Democratic party.
Over the last three business cycles, S&P 500 margins have made a series of higher highs with the technology sector increasing its contribution. What we observed in the ‘10s expansion was the diffusion of technology in other sectors; consumer discretionary and retail is an obvious example. Other manifestations of technology adoption include communication services and streaming of content. We expect this dynamic to expand across sectors in the ‘20s, with the financial, industrial, consumer discretionary and staples, and of course, the holy grail healthcare sector that has been the a drag on aggregate productivity for decades, all becoming increasingly reliant on technology to deliver products and services. This scenario is consistent with Goodhart & Pradhan’s thesis in “Demographics will reverse three multi-decade global trends” that with the massive labor supply shock easing, capital for labor substitution will proliferate. Consequently, while economists ‘analyze’ the impact of net employment contraction in dynamic sectors including leisure & hospitality, retail and construction, productivity growth is likely to build on the acceleration evident in the last couple of years of the ‘10s expansion driving potential profit growth higher.
https://www.bis.org/publ/work656.pdf
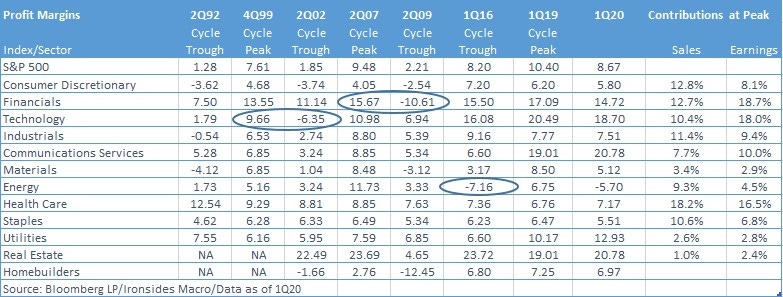
Figure 6: There are four sectors with margins greater than the S&P 500, two employ leverage, the other two are all about technology. Margins have only been mean reverting within an uptrend for decades, this cycle is likely to be driven by technology integration into healthcare, consumer products and industrials. Please see the link below for a detailed analysis of the role of intangible investment from the 2018 KC Fed Jackson Hole Conference.
https://www.kansascityfed.org/~/media/files/publicat/sympos/2018/2018crouzeteberly.pdf?la=en
The cyclical case for a recovery in earnings is equally as strong. Intuitively, it seems incongruous that the shortest, perhaps deepest recession on record, attributable to an exogenous shock rather than an endogenous supply-side imbalance, will be followed by an earnings recovery as long as the 2008-9 financial crisis. The recent surge in a diffusion index of analyst increases and decreases in earnings estimates, generally known as net revisions, has been surging. Early in the Covid Crisis, we offered the ‘80 Carter Credit Crunch as an analog and suggested that ISM manufacturing could follow a similar path. Even though the drop in 2Q20 GDP is likely to be greater than the 8% 1Q80 decline, the path for ISM in ‘20 in this rate of change indicator, was smaller than the drop from 50.2 in February 1980 to 29.4 in May, and recovered more quickly than the move back above 50 in September ‘80. We would note we were skeptical of forecasts of 50% 2Q20 GDP declines, after the June employment report the NY Fed tracking estimate stood at -15%, the same level we pencilled in on the CNBC Fed survey. Markets move on the rate of change.
Policy & Politics: Headwinds after Labor Day
Current trends in the betting markets look formidable for the Trump administration; however, as we listened to the details of a CNBC poll recently we heard a potential path for the GOP that was consistent with our pre-Covid 2020 election outlook. In the CNBC poll, the one question where the President maintained a significant lead over Joe Biden was on the economy, additionally a large percent of the independent voters switched their allegiance from President Trump to undecided. Our thesis back in November 2020 was though at that time economic concerns were low, running on a platform of raising taxes, particularly against an incumbent was a high risk strategy. For the majority of Americans, income tax policy is the administration’s most visible economic policy. Given the economic shock associated with the global pandemic, with fiscal stabilization employment disincentives, it is likely that the unemployment rate will be following a path like 2012 when Mitt Romney failed to convince the public that the pace of the recovery was unsatisfactory. In other words, unemployment will likely be improving faster than the Fed or street economists expect, but will still be creating sufficient economic anxiety for voters. A platform of raising taxes to pay for spending, even if it is targeted at corporations, capital gains, financial transaction taxes, carried interest and the wealthy, will still sound like tax hikes to many voters. Because this path remains open for the President and Republican Senate, we would fade any trends that develop related to a blue wave between now and Labor Day when polls count likely voters and undecided voters begin to decide. Less market friendly will be the Trump Administration’s anti-China platform. While Joe Biden is unlikely to strike a conciliatory tone, he will lack credibility with the public given his years in the Obama Administration and the Senate during the decades of China’s ascendancy in global trade market share.
https://ironsidesmacro.substack.com/p/2020-taxpayer-revolt
https://files.taxfoundation.org/20200429102525/Details-and-Analysis-of-Former-Vice-President-Biden%E2%80%99s-Tax-Proposals..pdf
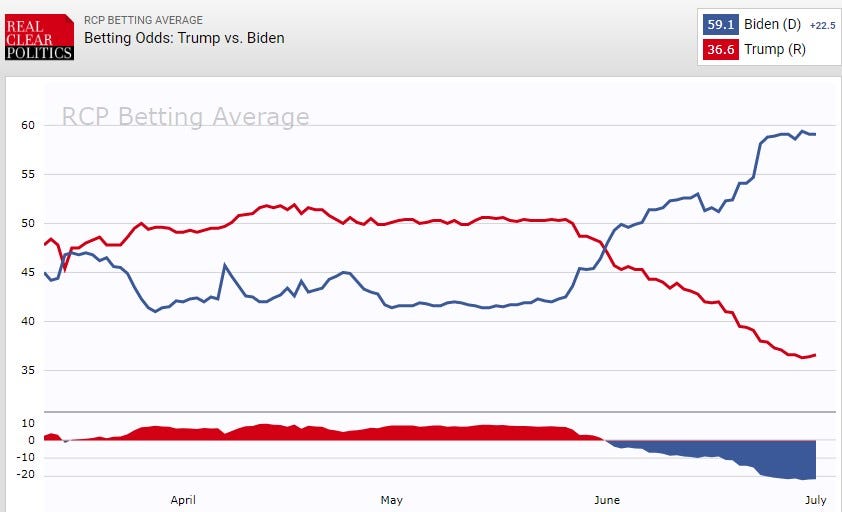
Figure 7: Biden’s momentum appears to have slowed for the moment, we suspect the June employment report was helpful.
Global Exports and Capex Rebound from the Trade War & Pandemic
The Trump Trade War, from mid-2018 through 2019, was the only period in the last 25 years when positive global growth and negative trade growth ‘co-existed’. Another negative externality of the trade war was the strongest US capital spending plans and business confidence in decades due largely to the Tax Cuts & Jobs Act (TCJA), was completely reversed. Consequently, lean inventories combined with a recovery in demand, point to a strong cyclical recovery in global trade in 2H20. Additionally, analysis from the Bank for International Settlements concludes that over the last decade the dollar has come to dominate trade finance. Separate analysis presented at the Kansas City Fed economic symposium last August showed the vast majority of global safe assets are also dollar denominated. Taken together, an easing of demand for dollars by investors is likely to increase the supply of credit for emerging market exporters. One final point, with a growing acceptance of deglobalization secular trends, investors are likely to be skeptical of a recovery in export activity. A durable, and likely powerful cyclical and contrarian rebound should make for decent returns in export sensitive markets. We like Mexico and Brazil, but suspect the developed world mercantilists including Germany, Japan and South Korea will perform well.
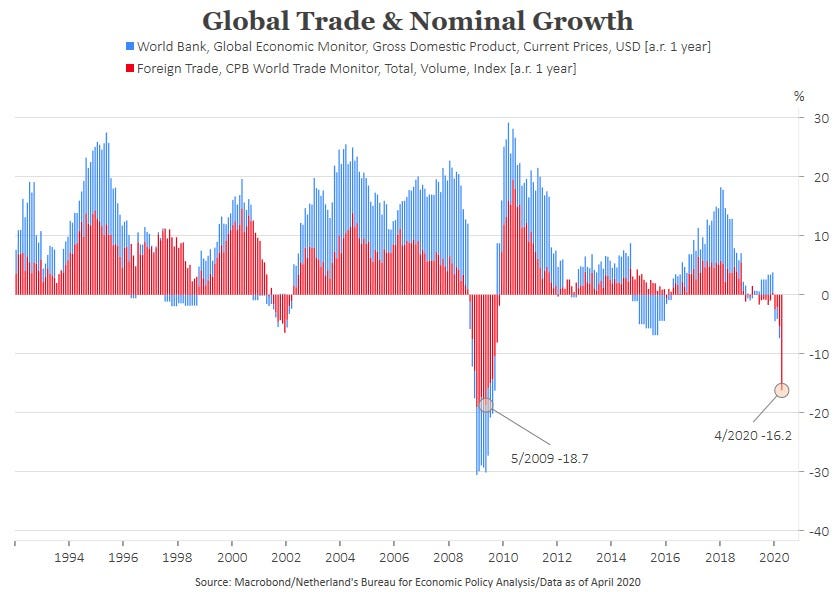
Figure 8: Mid-2108 through 2019 was the only period in recent decades when trade growth was negative while GDP was positive. We expect a robust recovery as demand returns and inventories restocked.
The reduction in the corporate tax rate by the Tax Cuts & Jobs Act provides substantial incentives for debt financed, long lived, physical investment. Consequently, in 1H18 structures investment grew 13% before the business confidence shock associated with the Trump Trade War derailed the mini-boom. Despite the immediate expensing provision, the after-tax cost of equipment investment that already was subject to 50% bonus depreciation, was offset by the lower rate given the life of these assets. When business confidence weakened during the most acute phase of the trade war, equipment investment fell. Meanwhile, intellectual property investment boomed as the incentive to make investments offshore in lower tax jurisdictions was offset by the lower rate and territorial tax system. With the trade detente in late 2019, we expected a strong year in all categories in 2020. As the effect of the Covid-19 shock fades, we were impressed about how quickly our capital spending plans index rebounded. We suspect we will hear during 2Q20 earnings reports that plans that were put on hold will be implemented in 2H20, perhaps aided by concerns that a change in the White House could result in a higher income tax rate and the loss of the R&D tax credit. The most durable trend is the software investment boom.
https://www.cbo.gov/system/files/115th-congress-2017-2018/reports/52419-internationaltaxratecomp.pdf
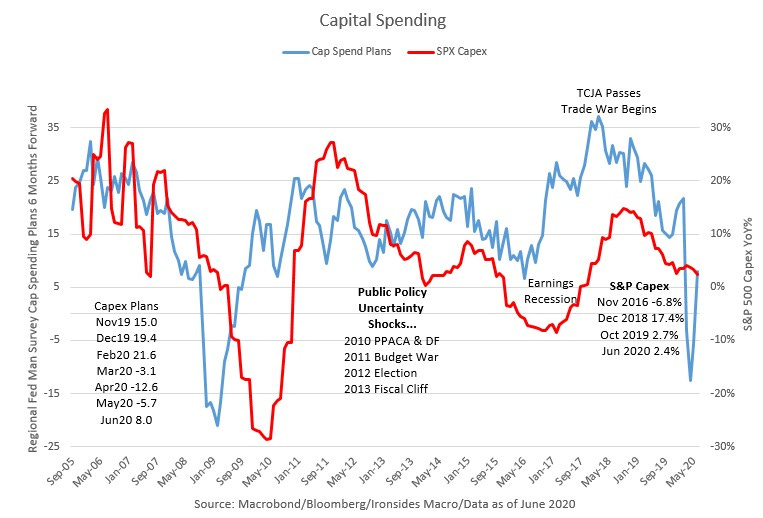
Figure 9: Capital spending plans came back quickly, we will be listening during 2Q earnings reports for 2H20 plans. We suspect they will be better than expected.
Time to Reduce Risk
Seasonal factors have been overwhelmed by the pandemic and vicious business cycle; however, following 2Q20 earnings season we believe the markets will be vulnerable to a typical August through October soft patch. Our volatility markets based sentiment and positioning methodology has not fully normalized, however they are far from the extreme levels they reached early in the recovery rally. We do not believe we are in a second wave of the pandemic in this country. We argued early in the crisis that the few serology tests that were available implied far greater prevalence than diagnostic testing indicated. As the number of new reported cases rises it is important to note that testing has increased five-fold from April, the positivity rate has plunged and death rates have fallen, indicating treatment has improved, the vulnerable are better protected and those with mild or no symptoms are being tested. The virus is doing what was inevitable; it is working its way through the population until we reach herd immunity. The costs of masks are low; the costs of authoritarian shelter-in-place and business restrictions are catastrophic. Governors who overreact will pay a political price, even if in the moment they are consistent with public polling. It’s the economy, local politician.
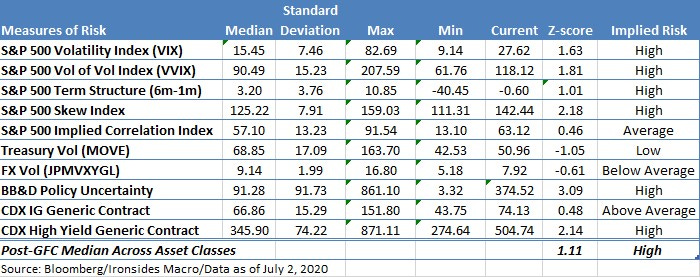
Figure 10: Equity market measures of risk remain elevated, with the exception of implied correlation, though less so than any point since the low. Treasury and foreign exchange rate implied volatility are direct beneficiaries of Fed policy.
As we work through earnings season, we suggest reducing risk ahead of negative seasonality from August through October. If you allocate across asset classes we do not believe Treasuries will be an effective diversifier, we prefer corporate credit. We would increase exposure to export dependent equity markets only marginally because beta effects imply they will fall more sharply than US equities on any significant (~8-10%) pullback. If such a correction does develop due to election concerns, we would increase exposure to a recovery in capital spending and global trade. We suspect that an election-related pullback would also create opportunities in healthcare, energy and perhaps financials as well. We are not making any changes to our sector recommendations, it is still early in the ‘20s expansion, and we want follow the recovery roadmap by being overweight economically sensitive cyclical sectors. However, we are suggesting that 2Q20 earnings season, beginning in two weeks’ time, will push equities a bit higher and strength should be used as an opportunity to reduce risk. Regardless of the outcome of the election, the equity market is likely to end 2020 on strong note. 2021 is a different story, that is when the outcome of the election will matter, a lot.
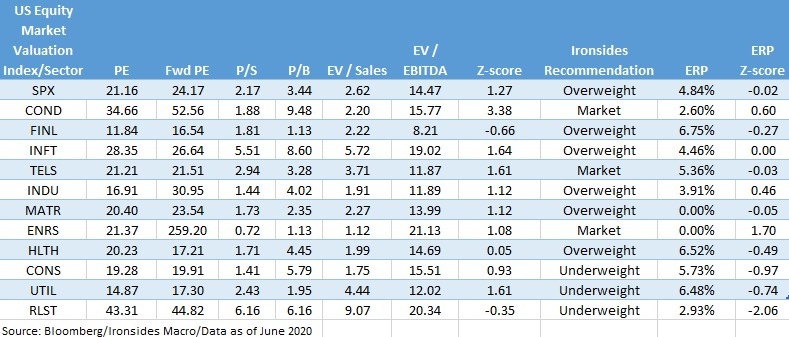
Figure 11: Financials and Healthcare are on our overweight list and score well on valuation.
We will be participating in the Alternative Vision Virtual Conference on July 28 & 29, please see the below link for additional information.
https://www.linkedin.com/posts/barry-c-knapp_alternativeinvestment-activity-6683338741525856256--iie
Barry C. Knapp
Managing Partner
Ironsides Macroeconomics LLC
908-821-7584
https://ironsidesmacro.substack.com
https://www.linkedin.com/in/barry-c-knapp/
@barryknapp
Reading List
Latest Book: “Trade Wars Are Class Wars”, Matthew C. Klein & Michael Pettis
“Showdown at Gucci Gulch, Lawmakers, Lobbyists, and the Unlikely Triumph of Tax Reform”, Jeffrey H. Birnbaum and Alan S. Murray
“A Great Leap Forward, 1930s Depression and US Economic Growth”, Alexander J. Field
“1493, Uncovering the New World Columbus Created”, Charles C. Mann
“Great Society, A New History”, Amity Shlaes
“The Second Machine Age”, Erik Brynjolofsson, Andrew McAfee
“Grand Pursuit, the Story of Economic Genius”, Sylvia Nasar
“The Rise and Fall of the Great Powers”, Paul Kennedy
“Capitalism in America, A History”, Alan Greenspan & Adrian Woolridge
“Diversity Explosion, How New Racial Demographics are Remaking America”, William H. Frey
“Clashing Over Commerce, A History of US Trade Policy”, Douglas A. Irwin
“Destined for War, Can America and China Escape Thucydides’s Trap”, Graham Allison
“The Constitution of Liberty”, F.A. Hayek
“Judgement in Moscow, Soviet Crimes and Western Complicity”, Vladimir Bukovsky
“1931, Debt, Crisis and the Rise of Hitler”, Tobias Straumann
My next book: “Nudge”, Richard H. Thaler & Cass R. Sunstein
This institutional communication has been prepared by Ironsides Macroeconomics LLC (“Ironsides Macroeconomics”) for your informational purposes only. This material is for illustration and discussion purposes only and are not intended to be, nor should they be construed as financial, legal, tax or investment advice and do not constitute an opinion or recommendation by Ironsides Macroeconomics. You should consult appropriate advisors concerning such matters. This material presents information through the date indicated, is only a guide to the author’s current expectations and is subject to revision by the author, though the author is under no obligation to do so. This material may contain commentary on: broad-based indices; economic, political, or market conditions; particular types of securities; and/or technical analysis concerning the demand and supply for a sector, index or industry based on trading volume and price. The views expressed herein are solely those of the author. This material should not be construed as a recommendation, or advice or an offer or solicitation with respect to the purchase or sale of any investment. The information in this report is not intended to provide a basis on which you could make an investment decision on any particular security or its issuer. This material is for sophisticated investors only. This document is intended for the recipient only and is not for distribution to anyone else or to the general public.
Certain information has been provided by and/or is based on third party sources and, although such information is believed to be reliable, no representation is made is made with respect to the accuracy, completeness or timeliness of such information. This information may be subject to change without notice. Ironsides Macroeconomics undertakes no obligation to maintain or update this material based on subsequent information and events or to provide you with any additional or supplemental information or any update to or correction of the information contained herein. Ironsides Macroeconomics, its officers, employees, affiliates and partners shall not be liable to any person in any way whatsoever for any losses, costs, or claims for your reliance on this material. Nothing herein is, or shall be relied on as, a promise or representation as to future performance. PAST PERFORMANCE IS NOT INDICATIVE OF FUTURE RESULTS.
Opinions expressed in this material may differ or be contrary to opinions expressed, or actions taken, by Ironsides Macroeconomics or its affiliates, or their respective officers, directors, or employees. In addition, any opinions and assumptions expressed herein are made as of the date of this communication and are subject to change and/or withdrawal without notice. Ironsides Macroeconomics or its affiliates may have positions in financial instruments mentioned, may have acquired such positions at prices no longer available, and may have interests different from or adverse to your interests or inconsistent with the advice herein. Ironsides Macroeconomics or its affiliates may advise issuers of financial instruments mentioned. No liability is accepted by Ironsides Macroeconomics, its officers, employees, affiliates or partners for any losses that may arise from any use of the information contained herein.
Any financial instruments mentioned herein are speculative in nature and may involve risk to principal and interest. Any prices or levels shown are either historical or purely indicative. This material does not take into account the particular investment objectives or financial circumstances, objectives or needs of any specific investor, and are not intended as recommendations of particular securities, investment products, or other financial products or strategies to particular clients. Securities, investment products, other financial products or strategies discussed herein may not be suitable for all investors. The recipient of this report must make its own independent decisions regarding any securities, investment products or other financial products mentioned herein.
The material should not be provided to any person in a jurisdiction where its provision or use would be contrary to local laws, rules or regulations. This material is not to be reproduced or redistributed to any other person or published in whole or in part for any purpose absent the written consent of Ironsides Macroeconomics.
© 2020 Ironsides Macroeconomics LLC.