2025 Outlook: Targeting a Trifecta
Policy regime shift, Productivity boom, Sustainable Disinversion, 70/30 Asset Allocation
2025 Key Forecasts
The Bessent Treasury ends the reliance on bill issuance, the market responds positively
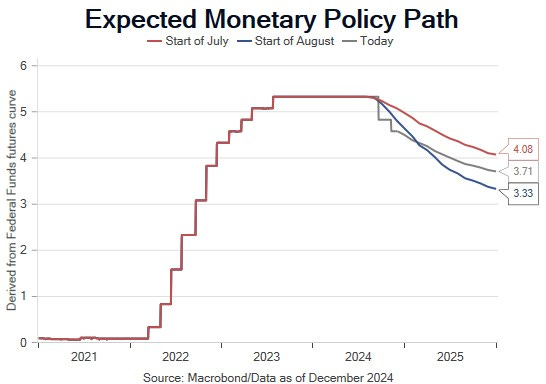
The FOMC reduces the policy rate to 3.25% by YE25
QT continues through 1H25 due to coordinated debt management
The biggest threat to bureaucracy is financial sector regulatory policy, a plus for bank stocks
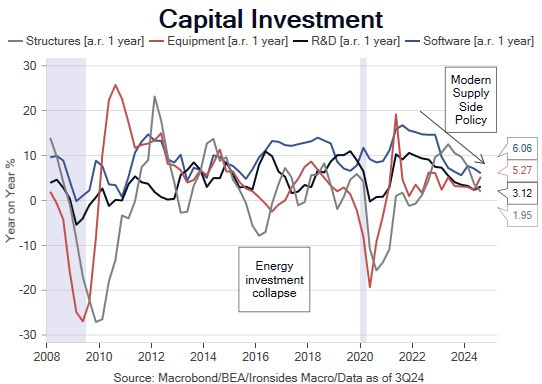
Capital investment recovers strongly improving the mix of growth
Productivity growth remains strong
Fiscal policy restructuring leads to a similar economic growth rate, with a better mix for earnings
Trade policy tightening has a smaller impact on stock prices and business confidence than 2018-19
Weak small business demand for labor persists through 1H25
The yield curve disinverts, our fixed income targets are 4.2% 10-year USTs, 3.5% 2s, 2s10 0.7% and 30-year agency MBS at 5%
The equal-weight S&P 500 rises 15%, Cap-weighted index 10%
Cap spending beneficiaries, industrials, energy and materials earnings momentum recovers and the sectors outperform
Outlook Summary
We are on the verge of a significant change in the fiscal, regulatory, and with a lag, monetary policy regime. The Biden administration ended the 50-year tacit bipartisan agreement that increases in spending beyond 20% of GDP would be confined to recessions, the Trump economic team is determined to run a primary surplus (receipts greater than spending before interest payments). An end to the Fed’s mandate creep since the global financial crisis is long overdue. We expect both the Treasury and equity markets to respond favorably to the regime shift that reduces the role of government in the capital allocation process. The trifecta we referred to in the title is Treasury Secretary Bessent’s Three Arrows, or three 3s, a 3% deficit, 3% growth and 3 million additional barrels per day of oil production.
The first of our three year-end notes, our 2025 outlook note, begins with a deep policy dive. We cover debt management, the QT and rate policy outlook, tax, spending and trade policy. Our section on the economic outlook focuses on whether strong productivity persists, a capital spending recovery, weak small business demand for labor and above target, but stable inflation. We then move on to the implications for investors of our policy and economic outlook. We spent much of ‘24 fading the ‘healthy broadening out’ cliche, primarily due to the policy regime shift we think the time to lean into that theme has arrived.
Policy Outlook: Fiscal, Debt Management & Monetary
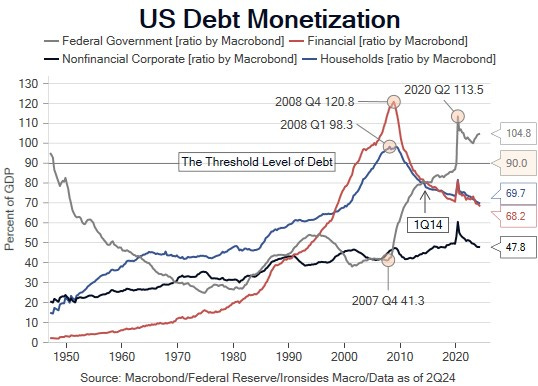
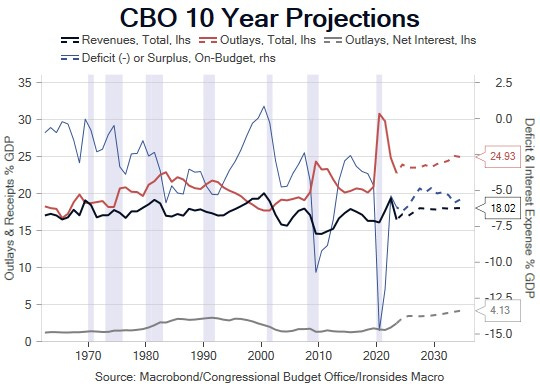
A paper presented at the 2011 Jackson Hole Economic Policy Symposium, “The real effects of debt”, concluded that when the debt to GDP ratio of the major economic sectors increased beyond 90% (the levels are slightly different for public and private sectors), debt switches from being welfare enhancing to degrading (good to bad). Monetization of household and financial sector housing debt from 2008 until 2014 doubled the ratio of federal debt from 40% to 80%, just below the Cecchetti, Mohanty and Zampolli government debt 85% threshold. Debt growth crept up towards the threshold over the balance of the business cycle, then exploded during the pandemic policy panic. Exceeding this level does not imply a Reinhard & Rogoff debt crisis, debt is a stock variable, and GDP is a flow variable, others have argued debt stability should be measured using national wealth as the divisor. That said, “The Fiscal Theory of the Price Level”, suggests the first order effect of unfunded government spending is hotter inflation.
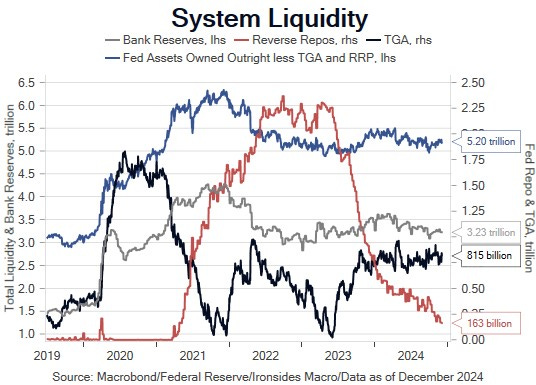
The growth of debt and deficits have turned debt issuance into as important of a monetary factor as the FOMC’s rate and balance sheet policies. Active Treasury Issuance (ATI, Stephen Miran’s acronym) has played a large role in the Treasury market since the Yellen Administration turbocharged ‘21 fiscal and monetary stimulus by draining the Treasury General Account rather than financing the American Rescue Plan Act (ARPA). There have been three waves of supply driven increases in longer term yields most evident in 30-year real rates and swap spreads; 1Q21, 3Q23 and 3Q24. The Yellen Treasury and Powell Fed combined increased bill issuance, even more passive QT and a rate policy recalibration to stabilize long term rates when 10-year USTs reached 5% in October ‘23, but the approach was a Band-Aid. These temporary measures are not sufficient to mitigate the inflationary impulse and crowding out from interest on the federal debt of other government priorities. Consequently, until and unless government spending is on a path to 20% of GDP from the current 24% level that the CBO projects will persist for the 10-year forecast horizon, debt management will be the biggest challenge for the Bessent Treasury. The initial response to Scott Bessent’s nomination in the week following the announcement, a 20bp parallel shift lower from 2s through 30s, combined with a tightening of swap spreads, was a market vote of confidence. The process kicks off with the suspension of the debt limit January 1 expiration date.
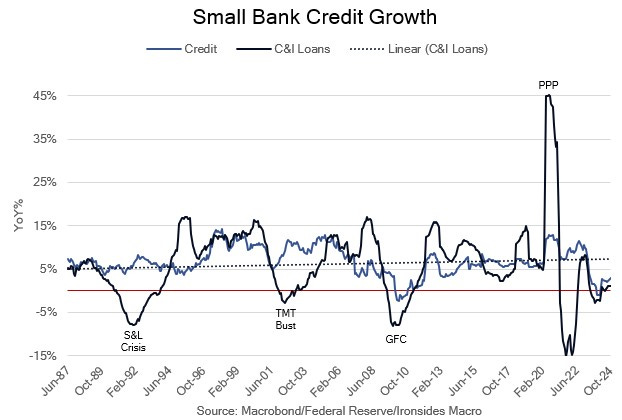
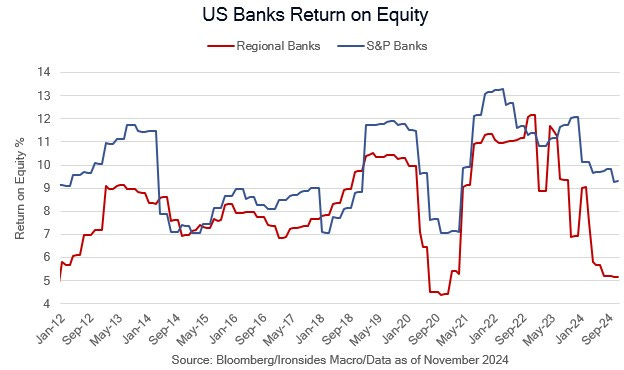
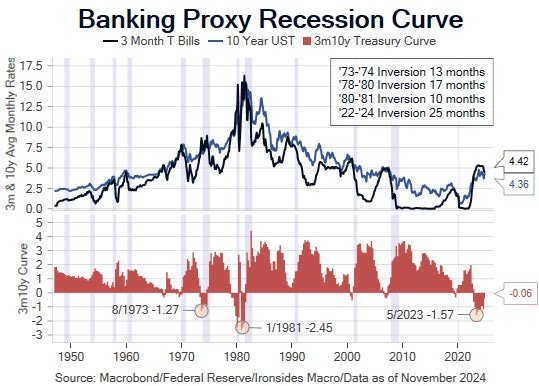
Meanwhile, the Fed’s aggressive balance sheet expansion from March ‘20 through March ‘22, dramatically increased their role in the capital allocation process. The pandemic easing primarily relied on QE, however the tightening process was primarily implemented using rate policy. The result was the longest curve inversion of the 3m10y banking business model proxy in US history (25 months and counting) that cut return on equity of small banks in half and effectively closed the credit channel to small businesses. Their focus on short rates and the effect on bank reserves of QT, while ignoring the duration and volatility channels of QE, is myopic and in need of reform. In a Bloomberg editorial on December 2, former NY Fed President Dudley wrote the following about the FOMC’s quinquennial (5-year) policy review:
“First, the Fed needs a framework for quantitative easing, the asset purchases it has used to provide added stimulus (and for its reversal, known as quantitative tightening). Without a framework, market participants struggle to understand when and how the policies will be implemented. This undermines their effectiveness, because market expectations affect longer-term Treasury rates, financial conditions and the transmission of monetary policy to the economy.
Second, a regime is needed to assess the costs and benefits of quantitative measures, to better understand what’s actually worth doing. Consider, for example, the last year of the purchase program that ended in March 2022: the Fed purchased $1.4 trillion in asset at a time when it was pretty clear that the development of Covid vaccines and the Biden administration’s immense fiscal stimulus would obviate the need for the added monetary stimulus. Those purchases will end up costing the U.S. taxpayer more than $100 billion. The total cost of the pandemic-era quantitative easing could reach $500 billion.”
The Fed faces several critical issues in ‘25, bank regulatory policy, QT, debt management, their quinquennial review and a sustainable yield curve disinversion.
Tax & Trade Policy: Sequencing is Critical
Congress appears likely to pass on a bipartisan basis (60 Senate votes) a second continuing resolution (CR) that will extend FY25 government spending at the current level through March. At that point, Congress is likely to pass an omnibus appropriations bill that provides spending for the remainder of FY ‘25 (through September 30). The omnibus will be a struggle, the GOP is likely to lobby for stage one Department of Government Efficiency (DOGE) cuts of unspent funds and government employment cuts, as well as spending in areas like border security that Democrats and some Republicans in the Senate oppose.
Concurrently, the budget reconciliation process is already underway with GOP House and Senate leadership and staff working on the bill(s). Reconciliation was originally intended to address taxes and entitlement spending, increasingly the focus has been discretionary spending. There is one of these bills allowable per fiscal year, though it is possible there could be two passed this year, one for FY25 and another for FY26. Senate Majority Leader Thune made a presentation to Republican colleagues, Speaker of the House Johnson and President-elect Trump, that called for an initial bill in the first 30-days of ‘25 that addressed border security, defense and energy policy changes. He then suggested a second bill later in the year for TCJA provisions, additional tax and spending cuts. Majority Leader Thune’s approach risks losing the business confidence momentum resulting from the election.
As we’ve been discussing since the election, addressing tax policy before, or at worse, simultaneously with trade policy, is crucial in realizing the optimistic regional Fed manufacturing and service providing sector orders and capital investment 6-month forward outlooks. Over the last two years, several periods of rapid increases in longer maturity real rates led to equity market corrections. Consequently, funding tax cuts with DOGE cuts and putting spending on a path to return to 20% of GDP will be crucial to stabilize the Treasury market and avoid a fourth wave of supply driven increases in longer maturity real rates. The optimal approach shifts fiscal policy towards broad-based private sector supply-side tax incentives. The NEC Director nominee Kevin Hassett is the key person to watch on the tax side, focus on the DOGE team to monitor the spending outlook. We all know who is charge of trade policy.
Credit to Meridian Research for background on the fiscal outlook.
The Threat to Bureaucracy
Ground zero for our view that regulatory overreach has reduced economic dynamism is the regulatory policy reactions to the financial crisis, pandemic and regional bank crisis. Those policies: the Dodd–Frank Wall Street Reform and Consumer Protection Act, Basel risk-based capital rules, abundant reserves regime, and QE, have made the system more unstable due to increased disintermediation and played a critical role in the sharp increase in government debt and spending. The 2019 repo rate spike, February ‘20 ‘dash for cash’ and Silicon Valley Bank collapse were all the direct result of regulatory policy intended to make the system safer. These policies reduced the banking system role in capital markets, private sector lending, investment banking and increased forced them to facilitate increased government debt and deficits.
The bank capital and Community Reinvestment Act (CRA) proposal from Biden Administration appointees at the Fed, FDIC and OCC, even after the revisions, will increase instability and deepen financial repression. Little wonder Trump Fed Board appointee Michelle Bowman fought Biden’s Fed Vice Chair for Bank Supervision tooth and nail over this proposal, her views are consistent with the Trump economics team. While President Trump won’t have any open spots to fill on the Fed Board until 2026, in our view Bowman would be an effective Chair of the FDIC. That would serve two purposes, that would make her Barr’s equal in the inter-agency regulatory process and open a spot on the board for a candidate determined to reduce the Fed’s market interventionism. Kevin Warsh would be our choice due to his view that the Fed’s balance sheet is too large and has distorted the capital allocation process. The law on firing board members appears clear, however, the President’s authority to demote the Chair of the FOMC, Vice Chair for Supervision or Vice Chair for Monetary policy is more ambiguous.
Debt Management: A Whole of Government Approach
In a discussion with clients this week, one of them proposed an approach to dealing with the debt bomb the Yellen Treasury has been financing with more short-term bills than their private sector advisors (Treasury Borrowing Advisory Committee) recommend. The suggestion was a joint effort between the incoming Treasury Secretary and FOMC sustainably disinvert the yield curve by cutting the policy rate to ~3% and increasing issuance of notes and bonds. This approach would allow QT to continue for longer than the current trajectory due to reduced liquidity draining resulting from the large bill issuance scheduled in 1Q24. We have long argued that the Fed’s excessive large-scale asset purchases, followed by aggressive policy rate hikes and passive balance sheet tightening, combined with the shortening of Treasury issuance duration has misallocated investment capital by suppressing longer term yields. The Fed and Treasury debt management has caused the longest inversion of the 3-month/10-year curve on record. The shape of the curve has resulted in floating rate borrowers, small banks and small businesses, bearing the brunt of the fiscal and monetary policy inflation shock and policy response.
Incoming Secretary Bessent, President Trump, NEC Director Hassett and the GOP controlled Congress cannot snap their fingers and make the debt disappear, but they can reduce inflation and capital misallocation while relieving pressure the on small banks and businesses by sustainably disinverting the yield curve. This approach would leave the policy setting broadly unchanged by loosening policy for small businesses but tightening policy for large banks and businesses can finance further out the curve. While some might raise concerns about mortgage rates, in our view the 1.4% spread of current coupon agency mortgage-backed securities to 7-year USTs could tighten to the 2014-2019 level near 1%. Additionally, if the budget process proceeds as we expect, and spending is reduced to 20% of GDP, the appetite for the increased note and bond issuance is likely to be strong from both domestic and international buyers. Specifically, curve disinversion is likely to broaden bank demand for securities to include small banks that have not participated in the ‘24 large bank purchases. In other words, the aggregate policy setting could wind up being easier with lower inflation risk.
All the bluster about Fed independence tends to come from those with a political ax to grind, stabilizing the debt requires a whole of government approach, including Congress, the Fed and Treasury Department. AS Chair Powell mentioned this week at the Deal Book Conference, there is a long tradition of weekly meetings of the Treasury Secretary and Federal Reserve Chair, we hope they tackle this issue immediately. Lengthening the duration of Treasury issuance, shrinking and shortening the duration of the Fed’s System Open Market Account (SOMA) and reducing spending are job one for incoming Treasury Secretary Bessent.
Passive QT & Rate Policy: Sustainable Disinversion
Until the Bessent nomination, our view was the FOMC would pause at 4% through 1H25 and perhaps all of ‘25. After the Bessent appointment and further consideration of the Committee’s probable new-Keynesian inspired response to reduced government spending and tighter trade policy, we now expect the YE25 policy rate to be reduced to 3.25%. The recalibration process is likely to be somewhat back-end loaded as they slow the process in 1H25 as Trump Administration policy unfolds and speed up cuts in 2H25. If the Bessent Treasury does increase note and bond issuance in 2Q following a debt ceiling deal attached to the omnibus spending bill, the Fed will allow QT to continue until at least mid-year. The big question when they stop QT will be the reinvestment process, will they continue to match the maturity profile of Treasury debt outstanding, or will they shorten duration as Kansas City Fed President Schmid and Dallas Fed President Logan suggested. We remain convinced they should return to the ‘bills only’ balance sheet policy in place from 1951 to 2008.
Economic Outlook: Capex Boom or Productivity Bust
Our framework for analyzing the economy is the impact of the mix of consumption and investment from the private and public sector on productivity, revenues, earnings and margins for equities. In this context, output driven by capital investment is preferable to consumption. Inflation and employment are the primary factors in the Federal Reserve’s reaction function, and increasingly since the pandemic policy panic, rising government debt and deficits are influencing Treasury prices. With this in mind, the Biden Presidency’s industrial policy that led to slower private sector capital investment, the largest inflation price level shock since the ‘70s Great Inflation, debt well above the 85% debt to GDP threshold, combined with the Fed’s excessive accommodation and clumsy tightening cycle (passive QT and aggressive rate hikes), as well as the Yellen Treasury’s transitory inflation gambit (reliance on short term financing), has left the Treasury market, and the economy in an unstable equilibrium. Despite four years of suboptimal fiscal, monetary and debt management policy, dynamism in the technology sector, and in the labor market broadly from mid-’21 to mid-’22, led to faster productivity growth. We do not expect real or nominal GDP or GDI to accelerate in 2025, if anything the bias is towards slightly softer growth during the policy transition, but with a better mix for equity and fixed income markets.
Productivity Acceleration: Cyclical or Secular
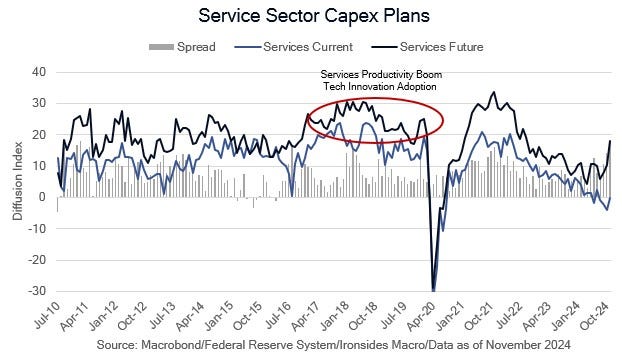
The first critical economic issue for ‘25 is whether the faster productivity growth is cyclical, a lagged response to the period of strong labor market churn, or secular, attributable to accelerated technology innovation adoption. For faster productivity growth to persist, and earnings growth to get anywhere close to the lofty 2025 expectations, capital investment needs to recover.
In the last two years of the prior cycle expansion, service sector labor productivity accelerated, likely due to technology innovation adoption as businesses substituted capital for labor when unemployment fell below 4%. Anecdotally, the pandemic appeared to accelerate this process, however the impact of the pandemic non-pharmaceutical interventions (lockdowns), fiscal and monetary policy responses, not to mention much lower response rates to government data, made the productivity data very difficult to read. The two most probable explanations for faster labor and total factor productivity growth are the lagged effect of the mid-’21 to ‘mid-’22 surge in labor market churn (improved skill matching, worker satisfaction), and technology innovation adoption.
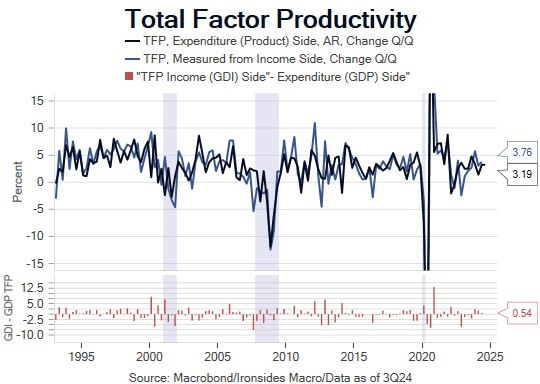
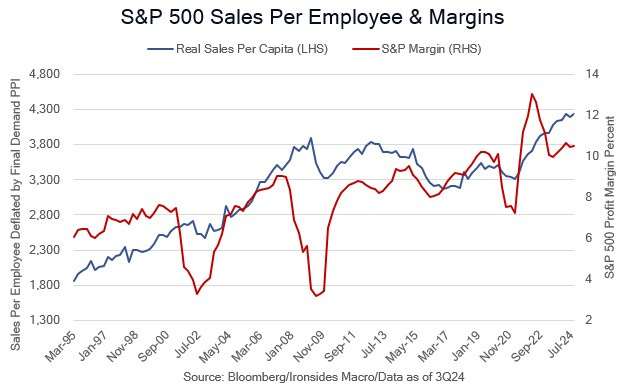
If the primary factor is the lagged effect of churn, productivity will slow in ‘25. Our attempt to measure the impact of productivity on the S&P 500 and economic sectors suggests our thesis that technology innovation adoption would diffuse to additional sectors is evident in rising real (deflated by PPI) sales per employee in the consumer discretionary, financial, technology, communication services and industrial sectors. This approach is far from definitive, however, even as core earnings growth stalled in 3Q24, margins firmed a bit and are 45bp above the 2019 average.
For those interested in a deeper dive on the topic, here is a paper released this week from the Kansas City Fed Research staff.
The Future of U.S. Productivity: Cautious Optimism amid Uncertainty
The outlook for capital spending plans improved sharply post-election, we will be hyper focused on surveys, top-down economic data and bottoms-up corporate analysis of capital spending.
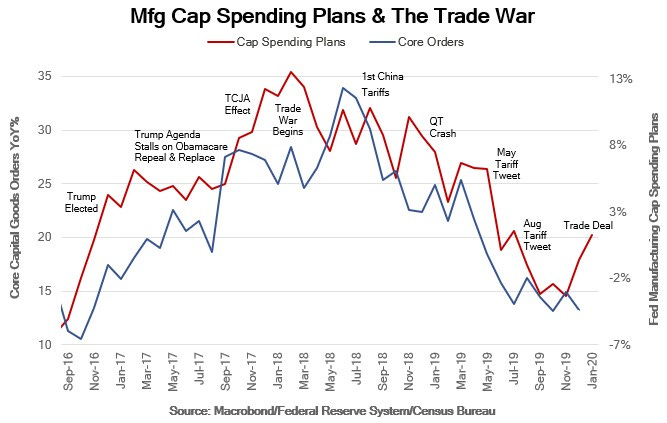
Next up is the transition from direct government spending industrial policy to reduced spending and increased trade frictions. We are not the least bit concerned that potential cuts in government spending and the impact on the labor market will reduce equity earnings, in part due to our expectation cuts will boost Treasury prices (the discount rate for earnings). However, while we view tariffs as changes in relative prices and an import tax, in other words, not inflationary, for equity investors there are costs. As we were writing this note we received a report from the New York Federal Reserve, Using Stock Returns to Assess the Aggregate Effect of the U.S.‑China Trade War.
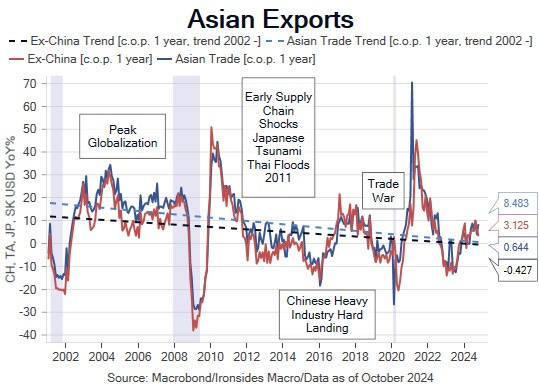
Much has changed since 2018, most notably China’s futile zero-covid policy was the mother of all supply chain shocks. Since the economics of producing in China to distribute products globally dissipated in the first half of the ‘10s, there has been a series of supply chain shocks including the Great East Japan Earthquake and Tsunami in ‘11, Thailand Floods the same year, US/China Trade War, the Pandemic Policy Panic and Russian Invasion of the Ukraine. In short, US companies still dependent on Chinese production are taking excessive risks. A second Trump Administration and increased costs of export dependency should surprise no one, however, China and Germany, primarily due to political constraints, have done little to reduce their mercantilist economic models.
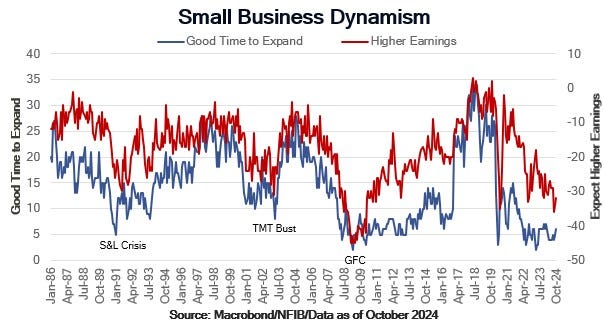
Another critical issue for 2025 is the elevated cost, and limited supply of credit for small businesses. The latest NFIB Small Business Survey respondents’ average cost of borrowing eased from 10.1%, the highest level since 2001, to 9.7% following the Fed’s 50bp September policy rate reduction. The longest inversion of the 3m10y banking proxy yield curve resulting from passive QT and aggressive rate hikes during the ‘22 to ‘23 tightening cycle is the culprit. The FOMC thinks they can take their time; we strongly disagree and urge a whole of government approach to policy.
Shaky Labor Market Foundation
For most investors, and likely FOMC participants, the November labor report intensified the debate over the ‘tale of two surveys’ but locked in another 25bp cut in December. From our perspective, the evidence that the Bureau of Labor Statistics is overestimating small business employment is compelling. We suspect when the dust settles on the debate between the current employment survey (CES) and quarterly survey of employment and wages (QCEW) for ‘23 and ‘24 we are likely to learn that the labor market was on the precipice of a nonlinear increase in the unemployment rate and recession. As critical as we’ve been of the FOMC over the last four years, the 50bp but in September was the best decision they’ve made since the pandemic began.
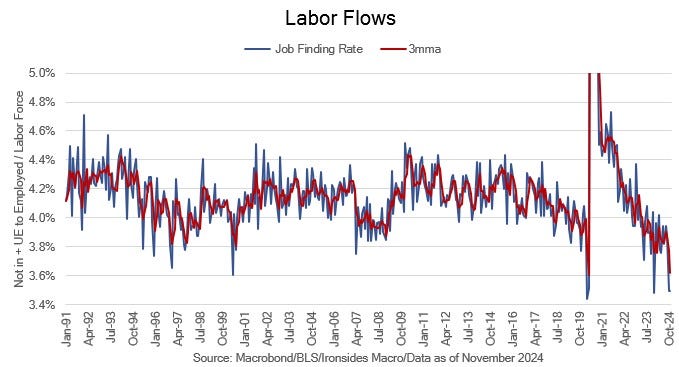
The job finding rate, the sum of workers who transitioned from not in the labor force to employed plus unemployed workers who became employed, was 3.49% in November and 3.50% in October, the only lower reading in the history of the labor flows data that began in February 1990, was March ‘20 at 3.44%. The 3-month moving average of 3.62% almost matches the 3.61% April ‘20 reading and is well below the ‘08 cycle low of 3.88% and ‘00 low of 3.80%. This series argues demand for labor is very weak.
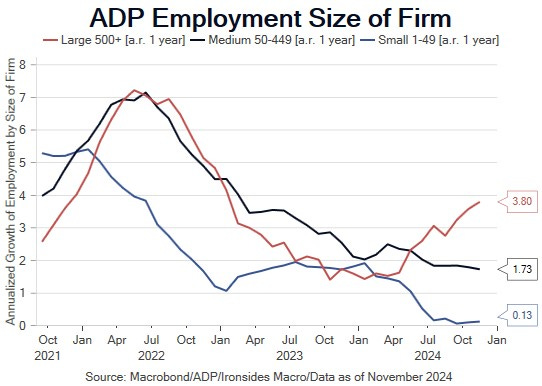
The restructured ADP employment series does not use a model to estimate small business employment, they have a robust database. While the series has been struggling with seasonal adjustment factors that were corrupted by the pandemic as many other series were, the very weak trend in small business employment and divergence relative to larger companies is a ringing endorsement of our view that monetary, fiscal and regulatory policies have disproportionally disadvantaged small businesses.
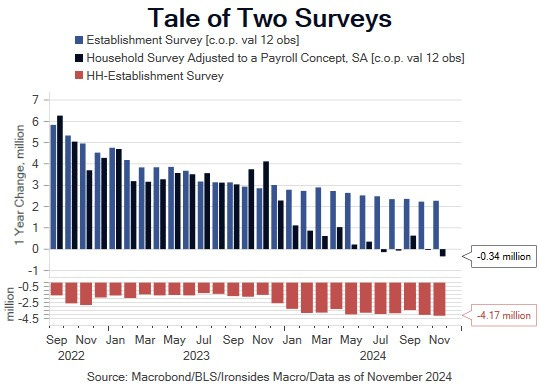
One final simple way to support our thesis that the monthly payroll data is overestimating small business employment is the comparison of the household and establishment surveys. Additionally, our model using the Conference Board’s labor differential, survey respondents characterizing jobs as plentiful less those saying they are hard to get, forecasted a 4.265% unemployment rate in November. The actual rate was 4.246%, in unrounded terms very close to a 4.3% reading. In September the rate was 4.051%, in October 4.145%, the November ‘23 reading was 3.725%. The correlation of these similar surveys was .95 pre-pandemic, further supporting our view the unemployment rate better captures the deterioration in demand than the monthly payroll figures.
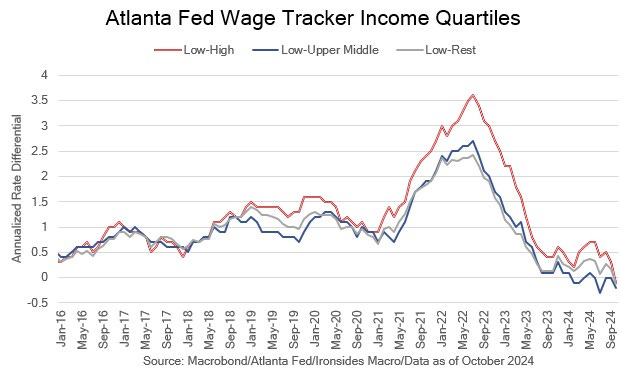
The weak labor market foundation and policy impact is also evident in lower income quartile relative wage growth. During the peak of the inflation and wage level shock from mid-’21 to mid-’22, relative wage growth for the lowest quartile hit record levels, however, real wage growth was negative due to an even larger increase in consumer prices. The concurrent surge in foreign born workers, and aforementioned policy pressure on small businesses, are the likely culprits in the collapse in relative wage growth for the lowest quartile. The shaky labor market foundation due to unintended consequences of excessive government intervention undoubtedly played a considerable role in the election outcome. We’ve made our suggestions to strengthen the foundation in the previous policy section.
Inflation: Policy Damage to Housing and the Super Core
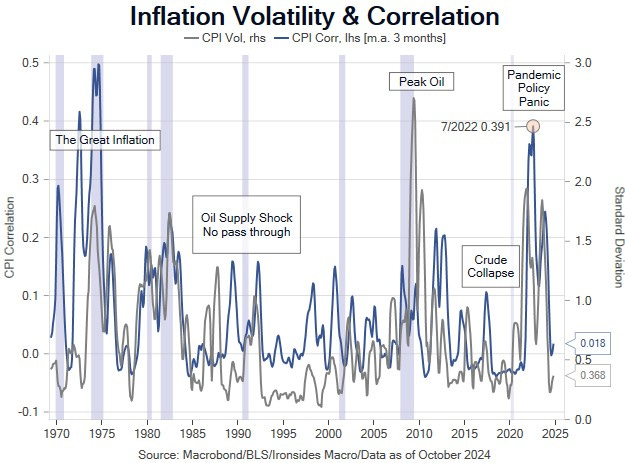
We chose three charts to tell the inflation story. The first is the annual volatility (standard deviation) and correlation of the major components of all items CPI. The Fed’s goal should be price stability, picking a specific 2% target is an anachronism of the post-financial crisis period when the Fed held the policy rate at the zero lower bound and was attempting to add additional stimulus to facilitate private sector deleveraging. On that basis, although there are considerable divergences between rates of inflation for the major categories, energy, food, goods, housing and non-housing services, volatility and correlation are at the low end of the last 50-year range. In other words, prices are stable. Just as pressing from below to boost prices to 2% caused unintended consequences like malinvestment in the ‘10s, pressing too hard from above to return to 2% will exacerbate the supply shortage in housing and further erode the small business foundation of the labor market. Additionally, unless they adopt our whole of government approach, they will deepen the dichotomy between households who hold assets and those that do not, as well as small and large businesses.
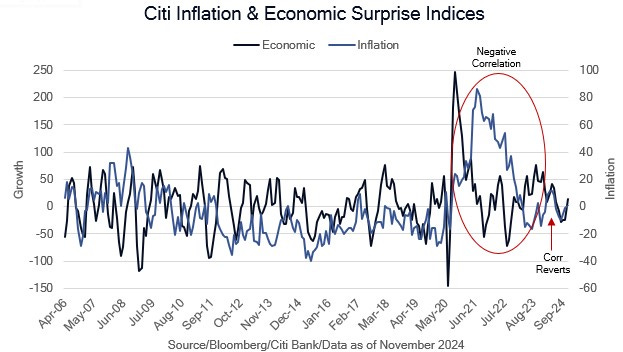
Our second chart illustrates the period where the Fed could focus exclusively on the inflation mandate is over. Beginning in late ‘23 inflation and economic surprise returned to the historically positively correlated relationship.
The final chart is supportive of our view that inflation is unlikely to return to 2% in the coming years. Through the ‘00s and the ‘10s, the trend rates of domestically determined housing (3%) and non-housing services (2.5%) inflation was well above the Fed’s target, disinflation was primarily attributable to goods prices that were flat. The skew is even larger today, in our view the Fed’s excessive easing and suboptimal tightening exacerbated the housing supply shortage thereby increasing trend housing inflation. Non-housing services inflation returning to trend is dependent on public policy, reduced government spending will help, but only if direct transfer payments to individuals are reduced and the crack down on illegal immigration is offset by legal entry that allows rational growth of the labor force. Goods prices are falling, with global trade slowing, we suspect the post-pandemic deflationary impulse originating in China will dissipate.
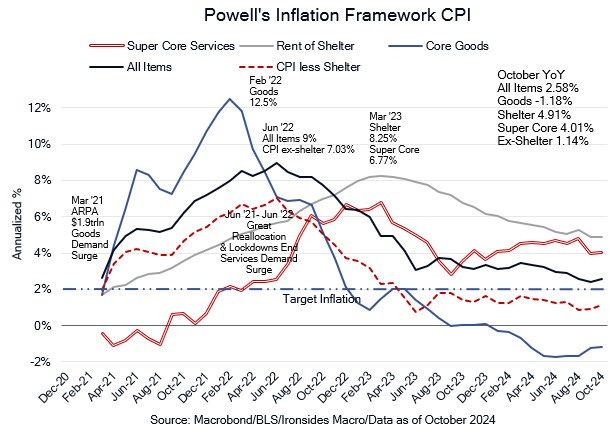
Consequently, while we doubt inflation will return to the Fed’s 2% target, low volatility in the vicinity of 2.5%-3.5%, is a favorable environment for the equity market due to positive operating leverage for capital intensive cyclical sectors. Current pricing of the Treasury market is somewhat high for this outcome, term premium should be higher, inflation compensation (breakevens or the difference between nominal and TIPS yields) is low, but not dramatically. The path to lower inflation runs through a primary surplus and sustainable yield curve disinversion that reopens the bank credit channel for small builders.
Asset Allocation: Remain Overweight Equities
Sustainable Disinversion & Debt Stabilization
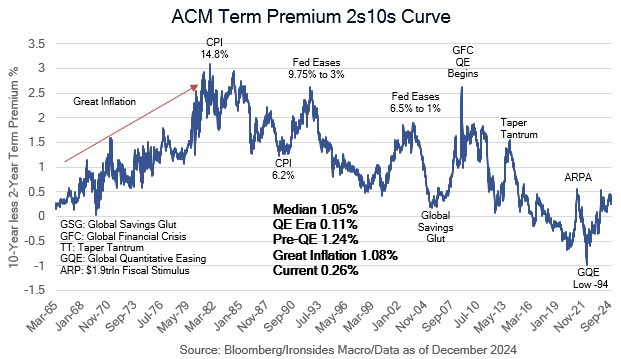
Treasury nominee Bessent’s Three Arrows, a 3% budget deficit (a primary, receipts less outlays before interest payments, surplus), 3% growth and an additional 3 million barrels per day oil production, is a reasonable framework for thinking about asset allocation in 2025. Given the time it will take to achieve the first goal, our whole of government approach to debt management and monetary policy, and increased global government bond supply, as well as reduced demand, as export dependent economies restructure their economic models, the best outcome is stable longer-term nominal and real rates in 2025. Consequently, we are going to stick to our 70% equities, 30% debt asset allocation, in other words overweight equities. The benchmark 10-year Treasury at 4.2% and Treasury Inflation Protected Securities (TIPS) at 1.9% with an 11bp term premium, is in the vicinity of fairly priced, if and only if, DOGE, the GOP Congress, and Trump economic team, make significant progress towards Bessent’s first arrow.
If our whole of government approach, increased coupon issuance, more QT and rate cuts to 3%, gets adopted, 2s will outperform the rest of the curve in terms of change in yield. We would reduce weight in the belly of the curve due to supply and add in the long end (10s-30s), as confidence in debt sustainability increases. In this outcome, mortgages should tighten to Treasuries and credit spreads are likely to be stable initially, then widen over time. Our targets are 2s at 3.5%, 10s at 4.2%, Fannie current coupon 30s at 5%, the benchmark investment grade CDX spread at 55bp and high yield at 325bp. In short, we expect to receive coupon payments with little principal change with the exception of agency mortgage-backed securities. The macro implication of our Treasury market forecasts is a sustainable disinversion of the yield curve, 2s10s at 70bp, marginally below its long-term average of 84bp, that significantly improves profitability of small banks, leading to a loosening of the bank credit channel for small businesses, and a more reasonable cost of capital.
The Real Healthy Broadening Out
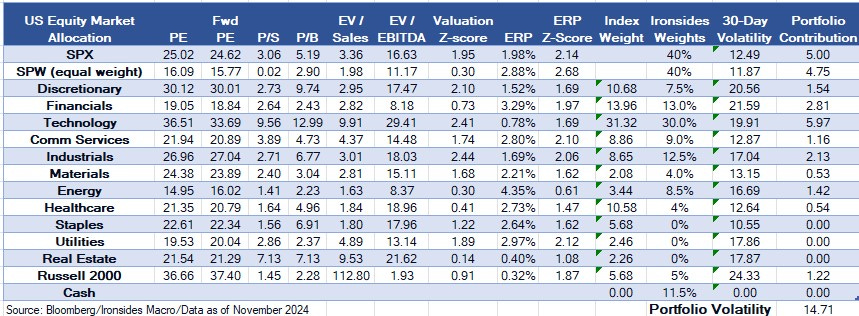
Having spent two decades in equity derivatives focused on probability distributions and second order effects, we rarely position for mean reversion just because. In short, we’ve had two really strong years, however, if you forget that the NBER never declared a recession and instead consider there was a 3-quarter ~8% earnings recession and associated 27% S&P 500 decline, the 70% rally from the recession low is far from historically exceptional. There is no doubt the capitalization weighted S&P 500 is historically expensive, our z-score framework using 6 metrics has the S&P 500 two standard deviations (SDs) above its 35-year median. Stretched valuation is concentrated by sector and capitalization, in sharp contrast, the equal-weight S&P 500 is only 0.3 SDs above its median and close to relative levels of cheapness to the cap-weighted index reached during the summer of covid (‘20), the financial crisis and tech boom (‘97).
Relative value is not a reason for our expectation for the gap to close, our expected catalysts are policy related; yield curve disinversion, broad based tax incentives, and deregulation. The process will take time, and as we discussed earlier, sequencing matters. Additionally, there are technical theories related to flows into index funds that may impede equal weight relative strength that we will address in a later note. With that in mind, if Senate Majority Leader Thune’s two reconciliation bill approach is accepted, the FOMC slows the recalibration process by skipping January or March, and the Bessent Treasury increases coupon issuance, the rally is likely to stall late 1Q/early 2Q. That said, we are generally optimistic for the whole of ‘25, primarily due to our expectation for a recovery in capital investment, deregulation, improved debt management, an improved budget outlook, and favorable corporate tax policy. Our target is a 15% return on the equal-weight S&P 500 and 10% for the cap-weighted index.
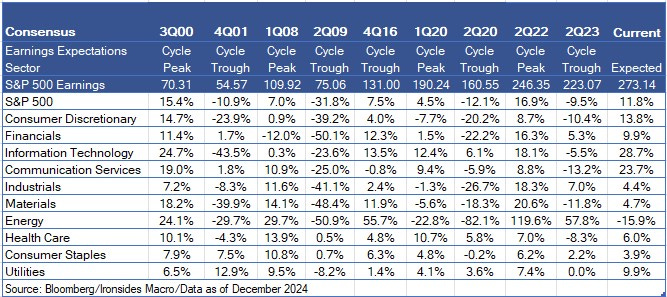
The first important issue for equities is the divergence between earnings momentum/net revisions and share prices. The final earnings season of each year tends not to have a similar immediate effect as the other three, due to an elongated process, rather than 80% of S&P 500 constituents reporting within 3 weeks, the process stretches to ~5 weeks. What the full year reports for most companies does provide is more complete guidance, we will be looking closely for evidence of a recovery in capital investment and increased optimism that improves expected earnings momentum. The latest quarter’s results were heavily skewed towards technology and communication services, in fact the broadening out of earnings this year many strategists expected was evident only in 2Q24 when the base was the bottom of the 4Q22 to 2Q23 earnings recession. Expectations for ‘25 remained dependent on the Gen AI beneficiary sectors. The top line estimate matters less to our outlook than a policy and business confidence driven broadening out of contributions from capital investment recovery beneficiaries (industrial, energy, materials).
Sector Allocation
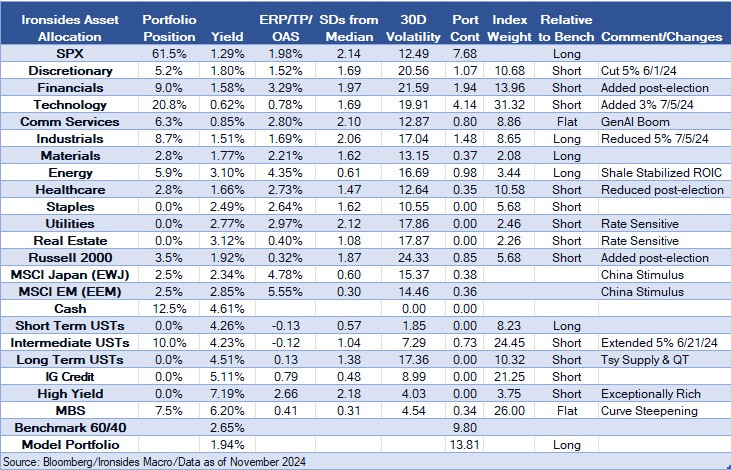
We were skeptical of the financial TV cliche ‘healthy broadening out’ for most of 2024, a view we primarily expressed by maintaining our maximum exposure to the technology and communication services sectors (market weight, 40% of the S&P 500 benchmark) and underweight small caps. We increased our exposure to the equal weight S&P 500 and sectors when the FOMC began the recalibration cycle and removed our underweight on small caps following the election. As we discussed in our economic preview section, we expect a recovery in capital investment. A better growth mix, namely lower government spending and stronger nonresidential fixed investment, will benefit the industrial, materials and energy sectors. We are currently overweight these sectors, when the timing and contours of tax policy take shape, we will consider adding exposure, potentially funded with marginal reductions in technology and communication services. Financial sector deregulation, a sustainable yield curve disinversion and increased private sector demand for capital, make a strong case for outperformance of the financial sector.
Foreign Markets: Exceptionalism Persistence
We are not the least bit tempted by valuation or relative performance to increase our allocation to international equities beyond our small Japanese and emerging market positions. The European political economic structure is modern supply side economics on steroids. We expect China to respond positively to increase barriers to trade by intensifying their support for their housing market, loosening the regulatory private sector regime and further incentivizing domestic demand. There has been investor frustration about a lack of concrete stimulus steps, we suspect they are waiting until they receive the demands of the Trump trade team before taking the next economic stabilization steps. In the meantime, they continue to exert a global deflationary impulse, and their equity market fundamentals continue to deteriorate.
Sector and Asset Allocation Tables Explained:
The US Equity Market Allocation table is our recommendations for a US equity investor, a similar approach to when we were the Head of Barclays US Equity Portfolio Strategy. The first six columns are valuation metrics, the seven is a Z-Score summary of the metrics relative to each sector’s valuation range since S&P introduced each sector (1990 for all but Real Estate). A reading of 1 implies the sector is 1 standard deviation above its historical median. The equity risk premium (ERP) column, also known as the Fed Model, is the forward (expected) earnings yield less the real 10-year yield (TIPS). Index weights are the S&P 500 with the exception of the Russell 200 small cap index, that is based on the market cap of the Russell 2000 relative to the Russell 3000. The final three columns are the Ironsides recommended weight, the 30-day volatility of the sector and portfolio contribution of our recommended weights to the risk (volatility) of the portfolio. Importantly, this approach does not integrate cross correlation of the sectors.
The asset allocation table benchmark is a 60/40 (stocks/bonds) portfolio, under the assumption that the investor is investing US dollars. We begin with our recommended weights, add the yield, the third columns are valuation metrics. ERP is the equity risk premium. TP is the term premium for Treasuries using the Adrian Crump & Moench model from Bloomberg. OAS is the option adjusted spread (early call risk) for fixed income securities. ‘SD’s’ from the median is a Z-Score approach to the valuation metrics, positive readings imply the asset is expensive, negative readings imply the asset’s valuation is below its longer-run median. The sixth column is the assets contribution to the risk of the portfolio, its volatility multiplied by the recommended weight of the asset. The index weights for equities use the same approach as the equity only portfolio, the fixed income weights are based on the Bloomberg US Aggregate Index, adjusted for the 60/40 benchmark. The final two columns are self-explanatory.
Final Thoughts
If you made it through this note in one sitting, we appreciate you. There was a considerable amount of ground to cover. Our goal is to help your investment process by adding our perspective on the policy and economic outlooks implications for asset allocation. Next up is our annual thematic note, it’ll be two weeks due to a trip to NYC and Boston next week. We will release a shorter note next week. The final of our three annual year-end notes will be the year-in-review note just before Christmas.
Barry C. Knapp
Managing Partner
Director of Research
Ironsides Macroeconomics LLC
908-821-7584
bcknapp@ironsidesmacro.com
https://www.linkedin.com/in/barry-c-knapp/
@barryknapp


