


2H22 Outlook: Mostly, They Made it Worse
2H22 Outlook: Mostly, They Made it Worse
Peak inflation, hawkishness & bearish sentiment

Mostly, They Made it Worse
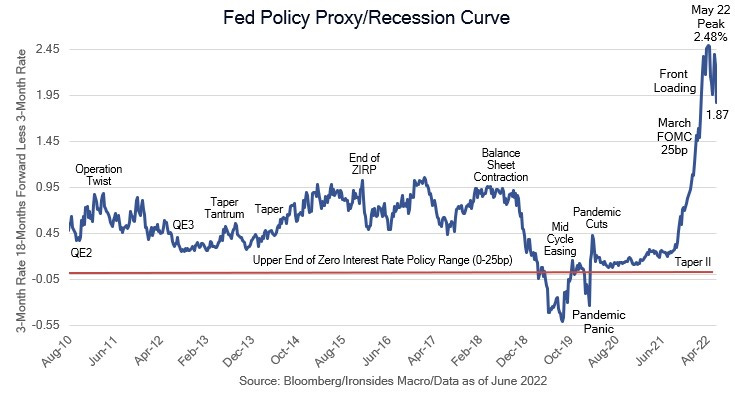
We once wrote an outline for a book with this title and subtitled it ‘40 years of financial crises and the policies that caused, exacerbated and set the stage for the next one’, and this was prior to the pandemic. Lockdowns, $5.3 trillion of fiscal stimulus, $1.8 trillion of Treasury liquidity injections into the banking system and Federal Reserve bond purchases of 1/3 of the Treasury and agency mortgage-backed securities market are the largest policy mistakes in 40 years of increasing intervention. We will save the diagnosis of how this happened for the book, if and when we get around to writing it. Suffice it to say, the politics of inflation led to a massive reversal of liquidity and the worst 1H equity market performance since 1970. While we got the direction right, the magnitude of the reversal exceeded our expectations. Nonetheless, our fundamental view hasn’t changed, since we expected the extreme divergence between the real economy and markets that has investors seemingly convinced a recession is either unavoidable or already here. As we’ve detailed in recent weeks, even if that is the case, an inflation driven recession implies contracting real growth, increasing nominal growth and a very small decline in earnings. The market has fully discounted our worst-case outcome, consequently we expect a significant rebound in 2H22. The cause of the storm — and subsequent policymaker panic, inflation — has peaked, which implies the easing of the Fed rate policy path over the last couple of weeks is unlikely to reverse. In other words, the point of maximum policy tightening expectations was the June FOMC meeting.
Peak Inflation
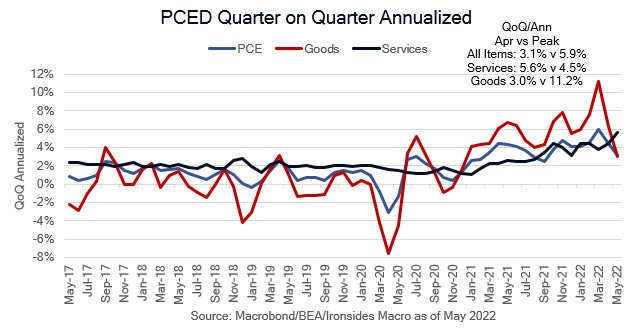
During 2Q21, the Fed and team transitory’s narrative that elevated year-on-year inflation readings, due primarily to base effects from the low depths of the pandemic readings, collapsed when the quarterly momentum readings surged. A year later, the core personal consumption deflator (PCED) has fallen from 5.7% quarter-on-quarter annualized in February to 4.2% in May. In other words, in 2Q22 inflation momentum is the antithesis of a year ago. While housing measures continue to rise due to methodology that causes a significant lag (approximately 6 months) relative to house prices and rents, the source of both decades of disinflation as well as the pandemic supply shock, namely goods prices, plunged from 11.2% in March to 3% in May due to supply chains clearing. All of our inflation indicators are headed lower; the correlation of 20 CPI components peaked in February after surging to levels last seen in the early ‘70s likely due to the 2021 twin fiscal and monetary policy massive overshoots. Inflation surprise peaked in July 2021. Our measure of price stability, the standard deviation of CPI and PCED, peaked in November at 1.5% and is halfway back to the pre-pandemic level of 0.5%. Average hourly earnings for nonsupervisory workers, led by manufacturing, trade and transport wages, are easing. Commodity prices are sharply lower as well. While the Fed waits for definitive evidence of peak inflation, inflation breakeven rates, the spread between nominal Treasury and inflation protected yields are now lower year-to-date for 5 to 30-year maturities. The benchmark 10-year is 0.64% below the April peak at 2.4%, the Fed’s 5-year breakeven inflation, 5-years forward model peaked at 2.6% in April and has fallen back to 2.19%. During 2H22, we expect goods price inflation to continue to fall, energy prices to level off, and services prices to lose momentum.
Rumors of the Expansion’s Demise are Greatly Exaggerated
The twin policy mistakes from monetary and fiscal policymakers in 2021 turbocharged demand for housing, autos and labor to levels that far exceeded available supply. While the Federal Reserve has admitted their mistake, fiscal policymakers have not admitted their own mistake, partially due to political considerations ahead of the midterm elections, the intention to make the expansion of safety net programs permanent, and an aversion to supply-side economic theory often derided as ‘trickle-down economics’. Consequently, fiscal authorities have placed their hopes for lower inflation almost exclusively on the Federal Reserve’s ability to reduce demand to a level that cools inflation without raising unemployment. You might be tempted to infer that our relatively optimistic economic outlook is predicated on the Fed’s ability to engineer a soft landing, however, we actually place a low probability on that outcome. In our version of the spontaneous economic order, monetary policy plays a much smaller role in economic outcomes than market participants generally believe, while economic dynamism, the ability for economic actors to adjust their behavior, is much greater — as evidenced by the much faster and stronger recovery from the catastrophic pandemic nonpharmaceutical interventions (lockdowns). For more on this topic see, Markets Fix Problems Policymakers Create.
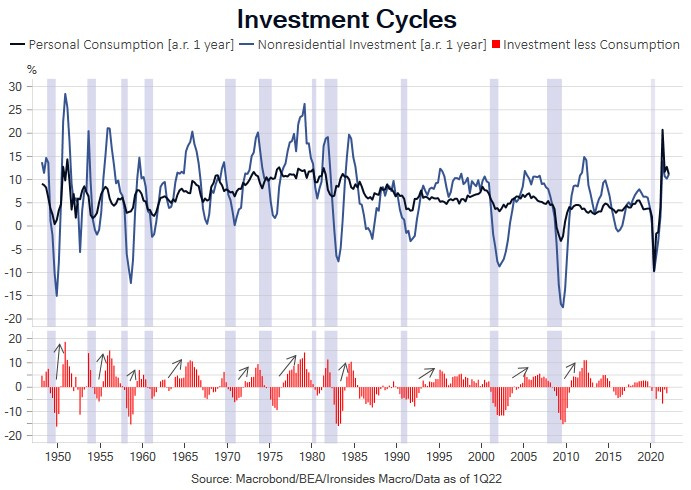
Our brand, ‘it’s never different this time’, did help us navigate the pandemic particularly with respect to the timing of the market low and relative sector performance in the first year of the recovery. In year two, the twin policy mistakes postponed the transition to mid-cycle leading to a boom/bust cycle for markets. While markets followed the recovery playbook, there were some unique characteristics to the shortest recession in US history. Nonresidential fixed investment did not fall more sharply than consumption as was the case in each prior post-war cycle, services spending dropped more sharply than goods consumption, and the recovery in goods was delayed by supply constraints. The rebalancing process is still underway: in Thursday’s weaker than expected personal spending report, services spending increased 0.7% from April, however durable goods spending plunged 3.2% likely due to continued supply constraints. The immediate market response was to increase implied recession probabilities, a reaction we view as incorrect due in large part to misunderstanding of the rebalancing process and the role of supply. The more important element of the May personal income and spending report was the price signal that the rebalancing process is well underway.
The Great Reallocation
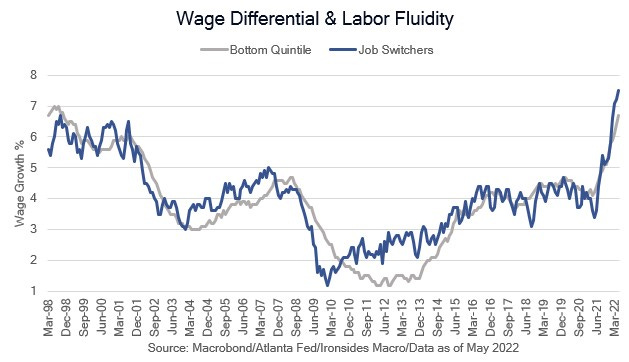
From the early days of the pandemic, we took the view that the pandemic was an inflationary shock that would bring three decades of goods deflation to a screeching halt. But on a more optimistic note, we argued the crisis would accelerate the technology innovation adoption that had boosted tepid financial crisis impaired productivity growth from 0.7% between 2011 to 2017, to 2% during the final two years of the ‘10s expansion. Productivity, as measured in government statistics, is a residual that reconciles hours worked with economic output. Before exploring the drivers of productivity, labor, capital and innovation, we urge caution with respect to the Bureau of Economic Analysis measures. We are not sure to whom to attribute this paraphrased quote (we last heard it from a Canadian portfolio manager on CNBC): ‘econometrics caused economists to transition from being generally right to precisely wrong’. In this context 1Q22 productivity was negative due to the negative contribution to GDP from the surge in imports. Were productivity measured using final sales to private domestic purchasers, or, by one of our preferred measures of output, gross domestic income (GDI) or gross output, it would not have contracted. Early in the business cycle government measures of productivity surge when output rebounds faster than employment, later as labor participation recovers productivity slows. This cyclical impulse masks the underlying trend. During 2H22 and into 2023 we expect to see productivity growth due to the combination of strong capital investment following last cycle’s very weak trend, the positive pandemic effect on technology innovation adoption, and increasing evidence that the Great Resignation was in fact the Great Reallocation. In other words, the most persistent catalyst for wage growth is likely to be a more dynamic labor force, not diminished slack. Dynamism leads to faster labor productivity growth and sustainable real wage growth, a trend that was evident in 2018-2019.
Policy Outlook
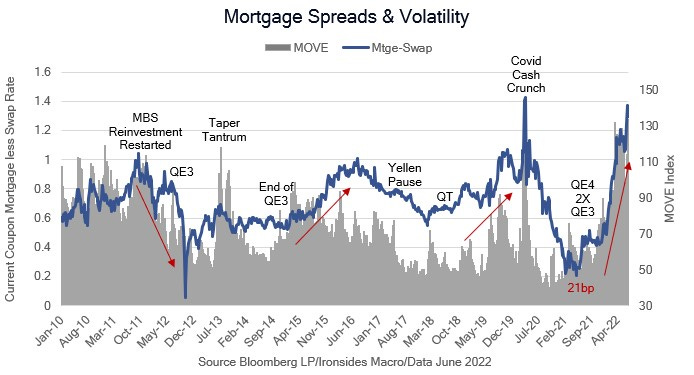
The market has become increasingly skeptical of the Fed’s forecast of the rate policy path in 2023. The June FOMC summary of economic projections (SEP) for the policy rate was 3.4% at the December 2022 meeting and 3.8% in December 2023. Over the last two weeks the January 2023 fed funds future rate has dropped from an above the SEP projection of 3.70% to 3.38%, in line with the Fed. More interestingly, the September ‘23 contract has dropped from a 3.94% peak at the time of the June meeting to 3.2%, implying the market expects a ‘94 outcome when the Fed reversed a portion of their hikes shortly after a year of tightening. We strongly suspect the market is onto something, not because the economy is going into recession, but instead because inflation has peaked. The politics of inflation will ease following the November midterms, and while Chairman Powell may admire Paul Volcker, the FOMC and their staffs are filled with Yellen disciples more sensitive to the employment mandate. We have been advocating more active balance sheet management, and their passive approach has not prevented another Taper Tantrum, in fact the adjustment in real rates, volatility, and mortgage spreads has been worse. Despite the Fed constantly citing the Taper Tantrum as a reason for passive balance sheet contraction, it was very similar to the 2004 adjustment to the beginning of the ‘measured removal of policy accommodation’ in terms of nominal and real rates as well as interest rate implied volatility. The FOMC has shown no inclination to change their approach and given our expectation for inflation we suspect there will not be serious discussions of selling mortgages outright and even if there were, spreads would not widen further. Mortgage REITs are attractive due this outlook, wide spreads and a favorable convexity profile.
Nondelegation Doctrine
The non-delegation doctrine is a principle in administrative law that Congress cannot delegate its legislative powers to other entities. This prohibition typically involves Congress delegating its powers to administrative agencies or to private organizations.
We suspect both F.E. Hayek and Alex de Tocqueville would be pleased the Roberts Court is pushing back on Congressional delegation of legislation to what Hayek dubbed the ‘administrative state’. The implications for energy policy are most obvious, however, the Trump trade war was another example of Congressional delegation, a process that began after the disastrous Smoot Hawley legislation with the ‘34 Reciprocal Trade Agreements Act, was extended in the ‘62 Trade Expansion Act that included Section 232 (steel tariffs), and again in the ‘74 Trade Act with Section 301 (China tariffs). These acts are examples of Congressional delegation leading to unintended consequences. They were intended to facilitate reduced trade barriers, but President Trump utilized them to increase barriers. It is likely that we are headed for divided government with a Roberts Court determined to strike down the Chevron Doctrine and force Congress to stop legislating by delegation. The first time we met Jeremy Siegel he made a compelling case for the role of the rule of law in Anglo American nations leading to long term equity market outperformance. We suspect laws like the Patriot Act, the Patient Protection and Affordable Care Act and Dodd Frank that expand the administrative state and circumvent Constitutional checks and balances are unlikely as long as the current makeup of the Court remains intact. This is good news for the healthcare (drug price controls), financial (capital requirements), energy (infrastructure) and more recently technology (antitrust) sectors.
Revisions & Chart Crimes
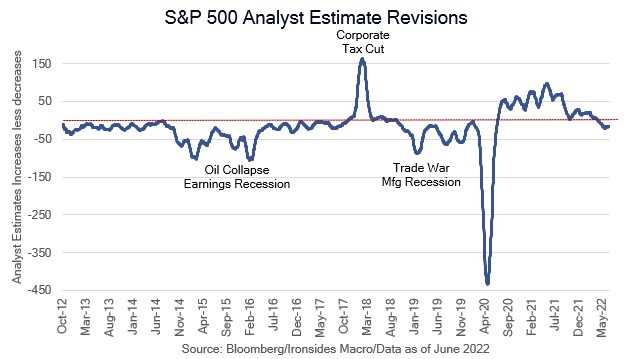
A client sent us a two-year chart of net revisions, the number of analyst estimates increases less decreases, a momentum index that leads changes in total estimates. The chart looked ugly, however, there was a very steep, albeit brief drop in earnings in 2020, an incredible recovery in 2021, consequently, the decline reflects little more than difficult comparisons particularly relative to the 2016 oil collapse earnings recession and Trump trade war global manufacturing recession in 2019. There is not much information in this leading earnings indicator, at least not yet. For a deeper analysis of earnings risk please see Real, Not Nominal, Recessions.
Markets Outlook: Liquidity Stabilization & Equity Market Recovery
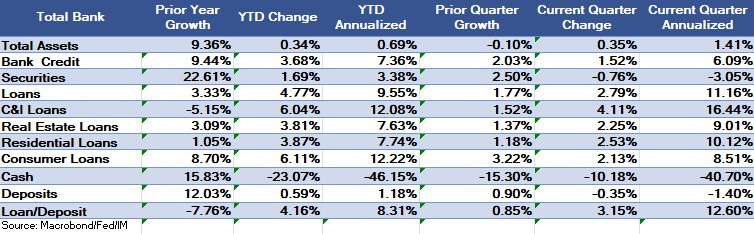
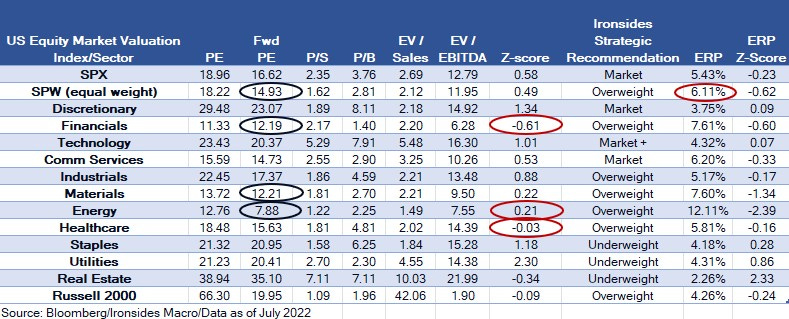
In our 2022 Outlook: Inflation Policy & Politics, we forecasted negative returns for equities and bonds primarily due to the reversal of the massive 2021 liquidity injections from the Treasury, Fed, Administration and Congress. While we expected a difficult first half, a 21% drop in the S&P 500 was larger than we expected. Nevertheless, our underlying fundamental and policy view hasn’t changed much. We expected the real economy and markets to diverge as counterproductive fiscal and monetary policy was reversed. We cited the financial sector as an example, as QE and the Treasury’s draining of their account at the Fed (TGA) left banks saddled with $4 trillion of reserves that were impairing profitability and causing them to raise expensive debt capital due to regulatory constraints (supplementary leverage ratio). In 2022, there is a very favorable asset mix shift underway from cash and government securities to higher spread private sector loans. Like 1994 during the aggressive tightening cycle investors overlooked this change as fears of a Fed policy mistake dominated investor psychology. However, when the cycle reached its maximum level of rate hikes in November when they hiked 75bp, the sector took off over the subsequent year. This is a microcosm for the broad economy and market: policy went from counterproductive easing and is far from tight, investor recession concerns with low and negative real rates are overblown. We expect very strong 2H22 equity market returns led by cyclicals and the value factor. Credit sensitive fixed income spread products will likely outperform Treasuries where Fed holdings are still exerting pressure on term premium.
Key Investable Themes & Asset Allocation:
Deglobalization & Capital Spending Boom: Industrials, Semis
Recession Hysteria: Materials, Financials, Energy, Small Caps
Technology Innovation Diffusion: Healthcare, Industrials and Financials
Global Equity Allocation: Overweight US equities, underweight export dependent economies (China, Germany, Japan)
US Asset Allocation: Overweight equities, underweight Treasuries, equal weight credit. Reduce cash, add equities.
Portfolio Hedging: Equity index skew is cheap
Barry C. Knapp
Managing Partner
Director of Research
Ironsides Macroeconomics LLC
908-821-7584
bcknapp@ironsidesmacro.com
https://www.linkedin.com/in/barry-c-knapp/
@barryknapp